3 July, 2018
Thanks for visiting the site.
U.S. Stock Chart Analysis
AOSL Alpha and Omega Semiconductor Stock Charting
Study the stock chart of Alpha and Omega Semiconductor, we see the price action continue to form lower high and lower low; bearish. Some may also find that the price action has been resisted by the moving averages, especially the long term, 100 period MA.
If you will study the chart to see when to buy, may be you should consider to add an indicator to provide confirmation.
You can add an indicator such as stochastic oscillator. See chart.
Number of time the over sold provide a good clue to buy. Manage your risk, as all set up can fail.
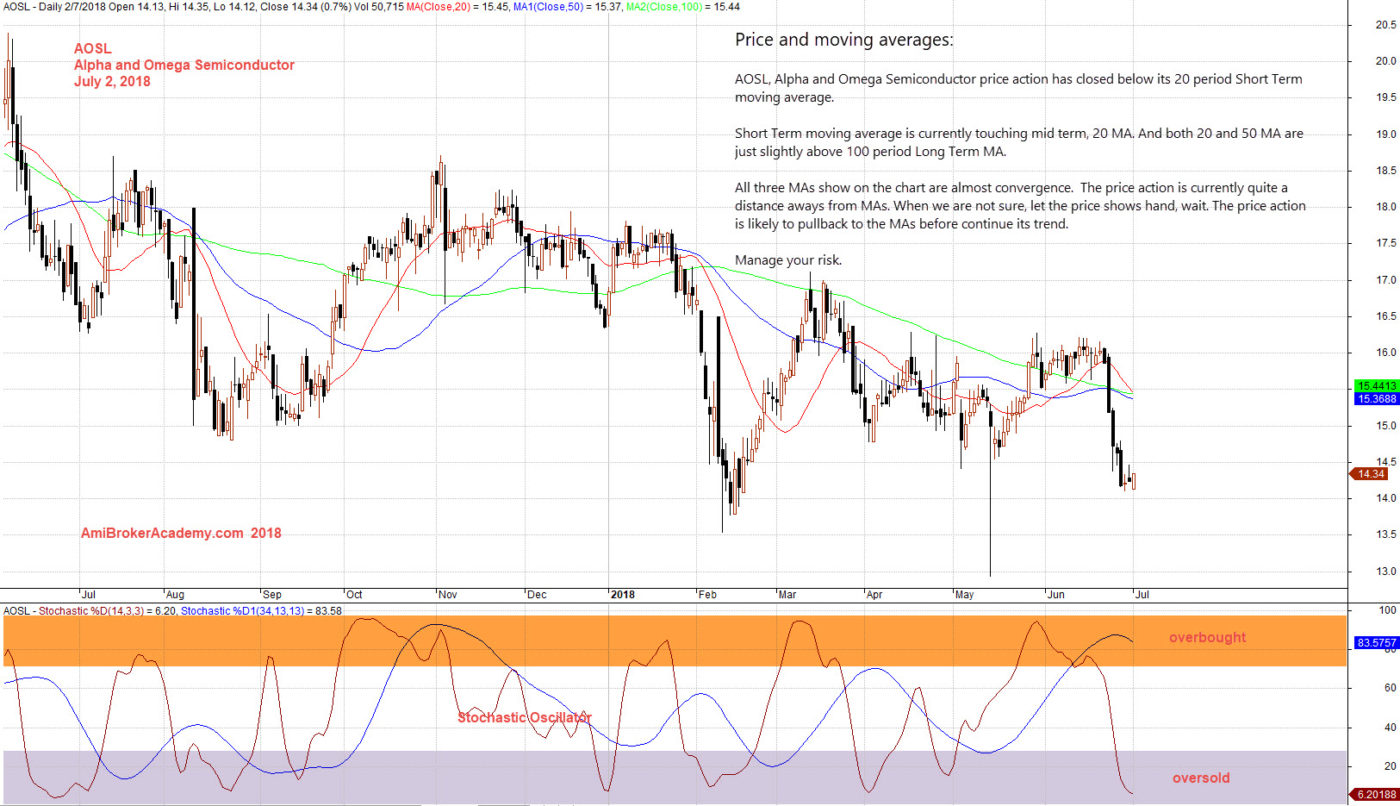
July 2, 2018 Alpha and Omega Semiconductor and Stochastic Oscillator
Moses US Stock Chart Analysis
AmiBrokerAcademy.com
Disclaimer
The above result is for illustration purpose. It is not meant to be used for buy or sell decision. We do not recommend any particular stocks. If particular stocks of such are mentioned, they are meant as demonstration of Amibroker as a powerful charting software and MACD. Amibroker can program to scan the stocks for buy and sell signals.
These are script generated signals. Not all scan results are shown here. The MACD signal should use with price action. Users must understand what MACD and price action are all about before using them. If necessary you should attend a course to learn more on Technical Analysis (TA) and Moving Average Convergence Divergence, MACD.
Once again, the website does not guarantee any results or investment return based on the information and instruction you have read here. It should be used as learning aids only and if you decide to trade real money, all trading decision should be your own.