May 14, 2017
STI Straits Times Index and 34 MA Wave
Picture worth a thousand words, see chart the price action cross above MA wave. The stock price action is very bullish. Manage your risk.
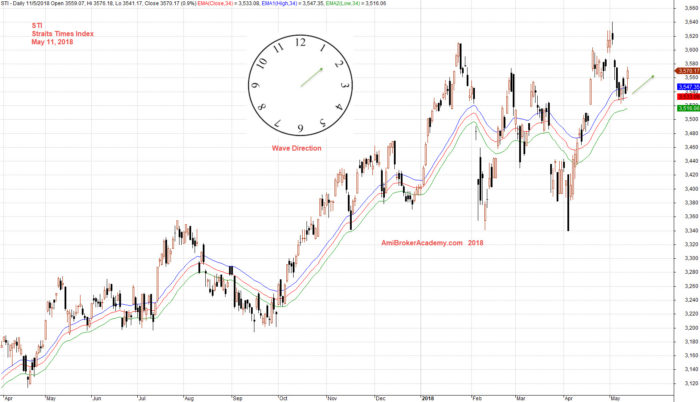
May 11, 2018 Straits Times Index STI and Wave
STI Straits Times Index Trading Strategy – Buy Support Sell Resistance
Picture worth a thousand words, see chart the price action. The simple strategy in all time will be buy support sell resistance. Besides that the price action is always moving in zigzag. If you could recognize ABCD pattern, you can reference the ABCD buy or ABCD sell for entry. But do remember all setup can fail. So manage your risk.

May 11, 2018 Straits Times Index STI and ABCD
ST Index and MACD
Picture worth a thousand words, see MACD indicator and trend. Do remember all setup can fail. Manage your risk.
STI is not ready to breakout 3600 level. See chart.
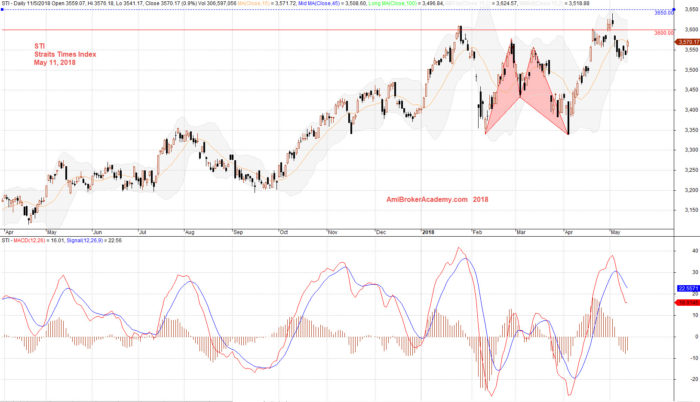
May 11, 2018 Straits Times Index STI and MACD
Moses
AmiBrokerAcademy.com
Disclaimer
The above result is for illustration purpose. It is not meant to be used for buy or sell decision. We do not recommend any particular stocks. If particular stocks of such are mentioned, they are meant as demonstration of Amibroker as a powerful charting software and MACD. Amibroker can program to scan the stocks for buy and sell signals.
These are script generated signals. Not all scan results are shown here. The MACD signal should use with price action. Users must understand what MACD and price action are all about before using them. If necessary you should attend a course to learn more on Technical Analysis (TA) and Moving Average Convergence Divergence, MACD.
Once again, the website does not guarantee any results or investment return based on the information and instruction you have read here. It should be used as learning aids only and if you decide to trade real money, all trading decision should be your own.