May 15, 2017
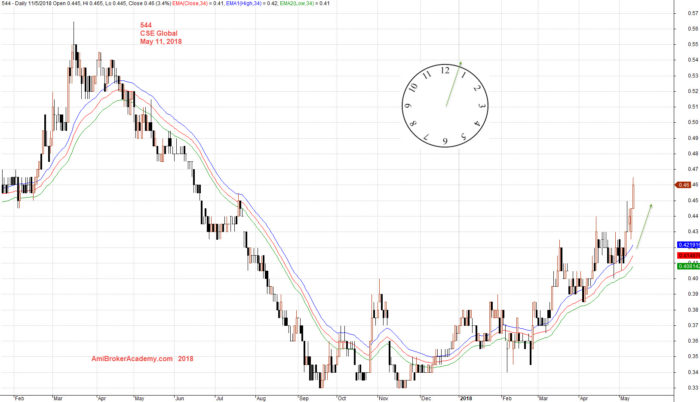
CSE Global and 34 MA Wave
Picture worth a thousand words, see chart the price action cross above MA wave then close below and stay below. The MA wave slopping up and bend and slopping down. So, MA provides a very visual and clear trend direction. If you will just guided by the MA wave, you are quite safe. But as said, all set up can fail. You should always trade with eyes open and manage your risk. Take profit as and when.
As in many of the example, the old trading strategy on buy and keep is no long quite apply for many of the stocks these days. Watch your own steps.
See the chart below, the stock price action took a turn when the price action keep attempted to close above the MA. So, be aware, the market emotion, and the market begin to think the stock price value should be different. The last part of the chart, you start to see the MA is slopping up and the price action begin to get supported by the MA, A reversal has happened. The stock price action is bullish again. Manage your risk.
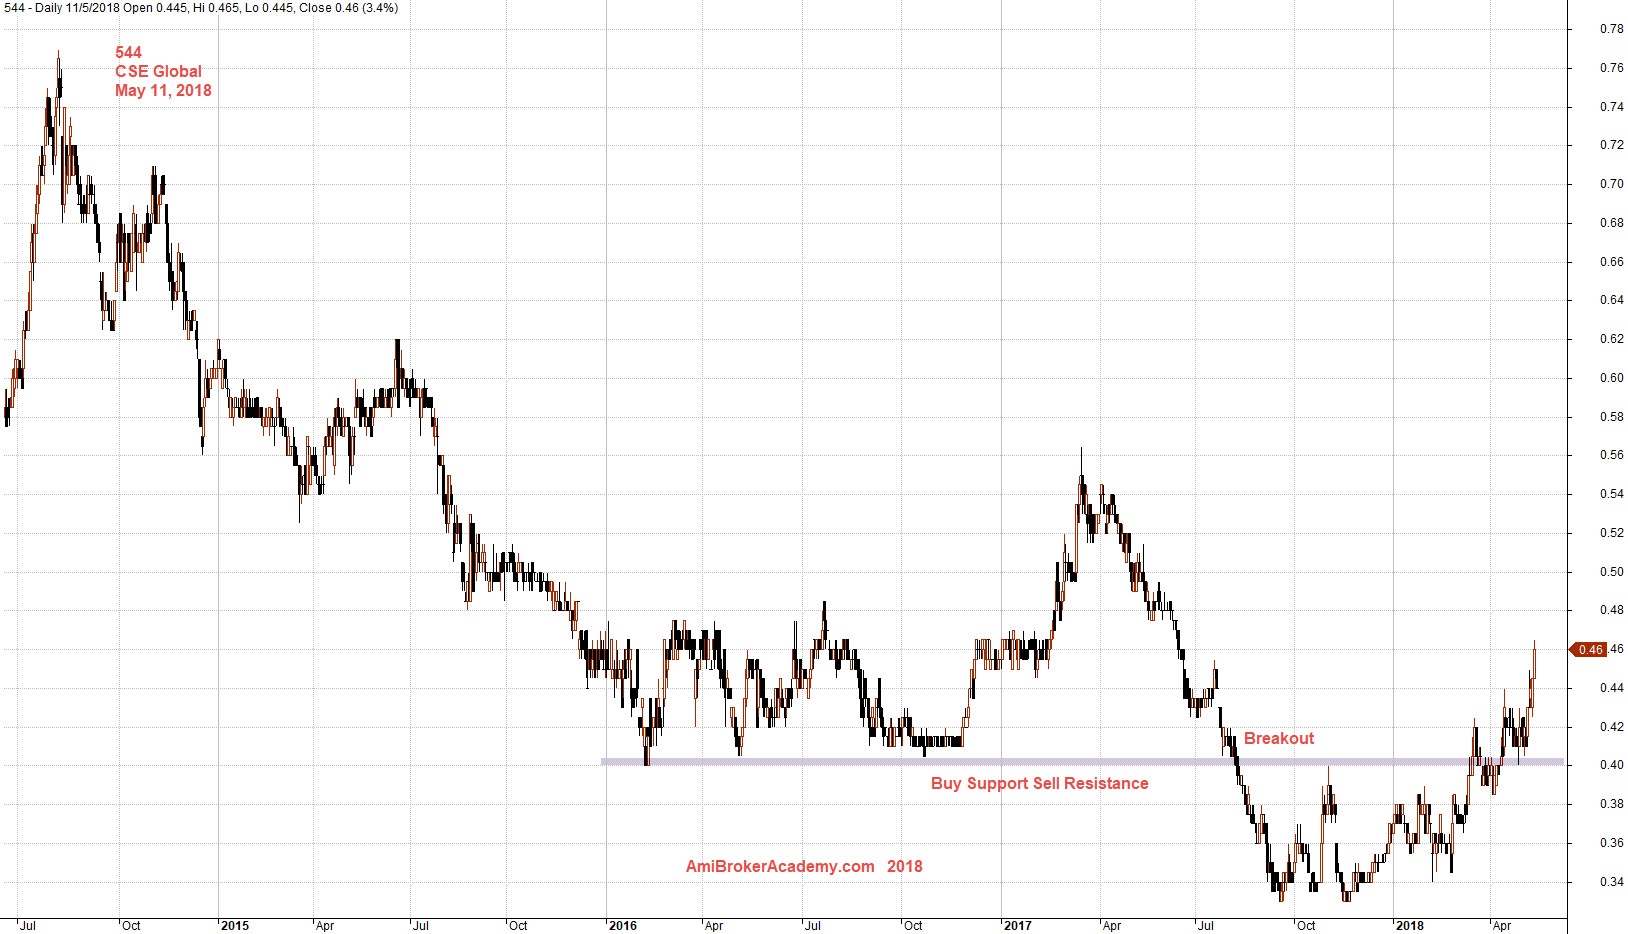
May 11, 2018 CSE Global and MA Wave
544 CSE Global Trading Strategy – Buy Support Sell Resistance
Picture worth a thousand words, see chart the price action. The simple strategy in all time will be buy support sell resistance. Besides that the price action is always moving in zigzag. If you could recognize ABCD pattern, you can reference the ABCD buy or ABCD sell for entry. But do remember all setup can fail. So manage your risk.
May 11, 2018 CSE Global Trading Strategy
CSE Global and MACD
Picture worth a thousand words, see MACD indicator and trend. Do remember all setup can fail. Manage your risk.
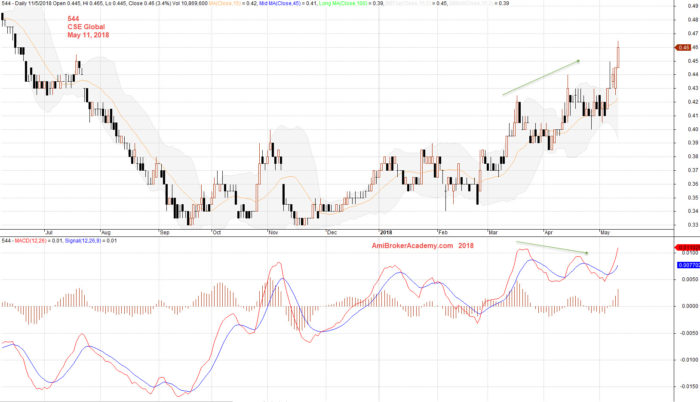
20180511 CSE Global and MACD
Moses
AmiBrokerAcademy.com
Disclaimer
The above result is for illustration purpose. It is not meant to be used for buy or sell decision. We do not recommend any particular stocks. If particular stocks of such are mentioned, they are meant as demonstration of Amibroker as a powerful charting software and MACD. Amibroker can program to scan the stocks for buy and sell signals.
These are script generated signals. Not all scan results are shown here. The MACD signal should use with price action. Users must understand what MACD and price action are all about before using them. If necessary you should attend a course to learn more on Technical Analysis (TA) and Moving Average Convergence Divergence, MACD.
Once again, the website does not guarantee any results or investment return based on the information and instruction you have read here. It should be used as learning aids only and if you decide to trade real money, all trading decision should be your own.