Trade with caution, I was told the trading day after the American Thanks Giving day November 25, is the most important trading day to watch. Singapore stocks market benchmark, Straits Times Index has finally bounced back after two weeks being chased after by the bear closed at 2694.43 points, up 50.5 points from last Friday closed. Can this be sustainable? It is really unknown. The trading volume has dropped a lot. Many are expecting the index to go lower.
We yet to see the American market performs tonight. Can the market bounced up? And how much?
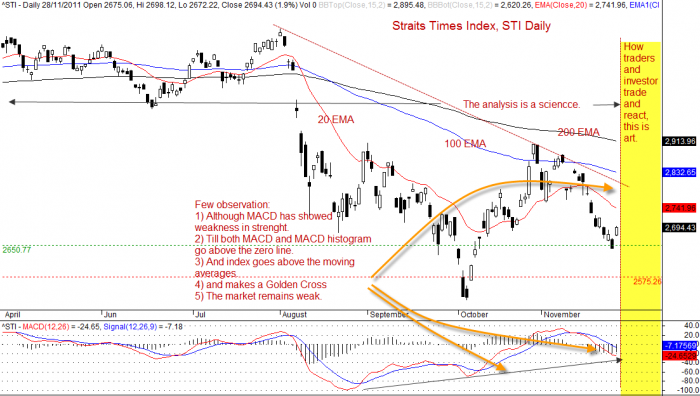
The chart shows the Straits Times Index daily chart. The 20 days, 100 days and 200 days EMA are still far apart and slop south. The index still remains below these EMA.
Using the MACD scanner, 8 stocks pass the MACD scan criteria, for volume exceeding 100K and price closed above $1.
MACD indicator makes up of 2 lines. The MACD Line (fast line) and MACD Signal Line (slow line).
When the MACD Line crosses over the MACD Signal Line the trend is bullish. When the MACD Line crosses below the MACD Signal the trend is bearish.
When the MACD Line crosses above zero line the trend is bullish. When the MACD line crosses below zero line the trend is bearish.
| Ticker | type | Close | Vol.(K) | Screening Result |
| MS7 | bullish |
1.135 |
3413 |
MACD Cross-Up Signal |
| S68 | bullish |
6.18 |
2056 |
MACD +ve Divergence |
| T39 | bullish |
3.89 |
1728 |
MACD Cross-Up ZeroLine |
| ME8U | bearish |
1.06 |
869 |
MACD Cross-Down Signal |
| C07 | bullish |
45.92 |
231 |
MACD Cross-Up ZeroLine |
| R01 | bearish |
2.11 |
217 |
MACD Cross-Down Signal |
| C2PU | bullish |
1.8 |
153 |
MACD Cross-Up Signal |
| S41 | bullish |
2.22 |
139 |
MACD-H +ve Divergence |
Disclaimer
The above result is for illustration purpose. It is not meant to be used for buy or sell decision. We do not recommend any particular stocks. If particular stocks of such are mentioned, they are meant as demonstration of Amibroker as a powerful charting software and MACD characteristics. Amibroker can program to scan the stocks for buy and sell signals.
These are script generated signals. Not all scan results are shown here. The MACD signal should use with price action. Users must understand what MACD and price action are all about before using them. If necessary you should attend a course to learn more on Technical Analysis (TA) and Moving Average Convergence Divergence, MACD.
Once again, the website does not guarantee any results or investment return based on the information and instruction you have read here.