Anyone has a crystal ball that can see the future, knowing when to enter and when to exit the market. When will the market turn bullish and remain bullish?
The markets are bearish and major bank at US are very weak. The stocks are cheap but can go cheaper. Is it at the bottom? Who will know? Answer is no one. No try to catch the bottom unless you are trained. Technical Analysis does not provide the yes and no. It provides the high probability that where market is trending. It is a scientific ways to analyze the data to see where the trend is. The chart also shows the emotion of the traders and investors. The market is moved by the buyers buy and sellers sell. The fear, greed and the psychology of the traders and investors cause the market to move, to become volatile.
See chart on Citibank, Bank of America and New York Stock Exchange Index, NASDAQ for better appreciation of the market since 2008. BOA and Citibank have been going sideways since August 2009 after they recovered from the drop in early 2008.The prices start to drift south again since beginning of the year. Can the market go weaker? The moving averages can tell a story. You may want to trade very carefully in this current market. Both banks 20 days, 100 days and 200 days EMA starting to open up again and the prices has stay below these moving average. It is still bearish.
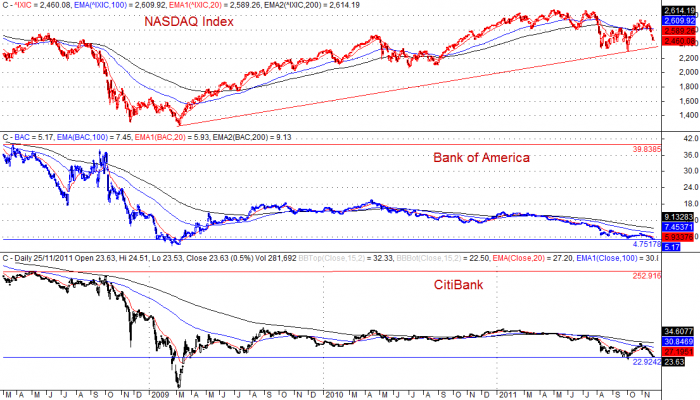
There is a lot of work to be done to restore the confident. How? BOA has been fallen from $39.83 in early 2008 till now at $4.75. Citibank has similar fall too, it has fallen from $252.91 to today $22.92. Are these banks too big to fell? Will see. Many of Analysis will give their version of story and prediction.
Same goes for Singapore Stock Market, the market benchmark Straits Time Index, STI. See the early analysis for information. Many analysts are making their predictions, some say it will not lower than 2500 by the end of year. Another sees it that it should be bind bong between 2200 and 2500. For those still optimistic feels that the STI may move up to 2900 and bouncing between 2600 and 2900. Say what you like, the market remain weak with all the markets around the world are weak.
As long as the index stay below the fast moving average like 20-days and 50-days. And 20 and 50-days moving average stay below 100 and 200 days moving average, it will remain bearish. In such circumstance there will be still stocks that are bullish, but trade with caution.
Disclaimer
The above result is for illustration purpose. It is the author view. It is not meant to be used for buy or sell decision. We do not recommend any particular stocks. If particular stocks or indices of such are mentioned, they are meant as demonstration of Amibroker as a powerful charting software. Example, it can insert another price or index such as NASDAQ, BOA and Citibank to compare the trend and do your trading plan.
Once again, the website does not guarantee any results or investment return based on the information and instruction you have read here. Please get your advice from the professional financial consultant.