April 14 2020
Welcome to AmiBrokerAcademy.com. Thanks for visiting the site.
A glance at a chart with Moses. Hold no position and stay free.
Chart At A Glance
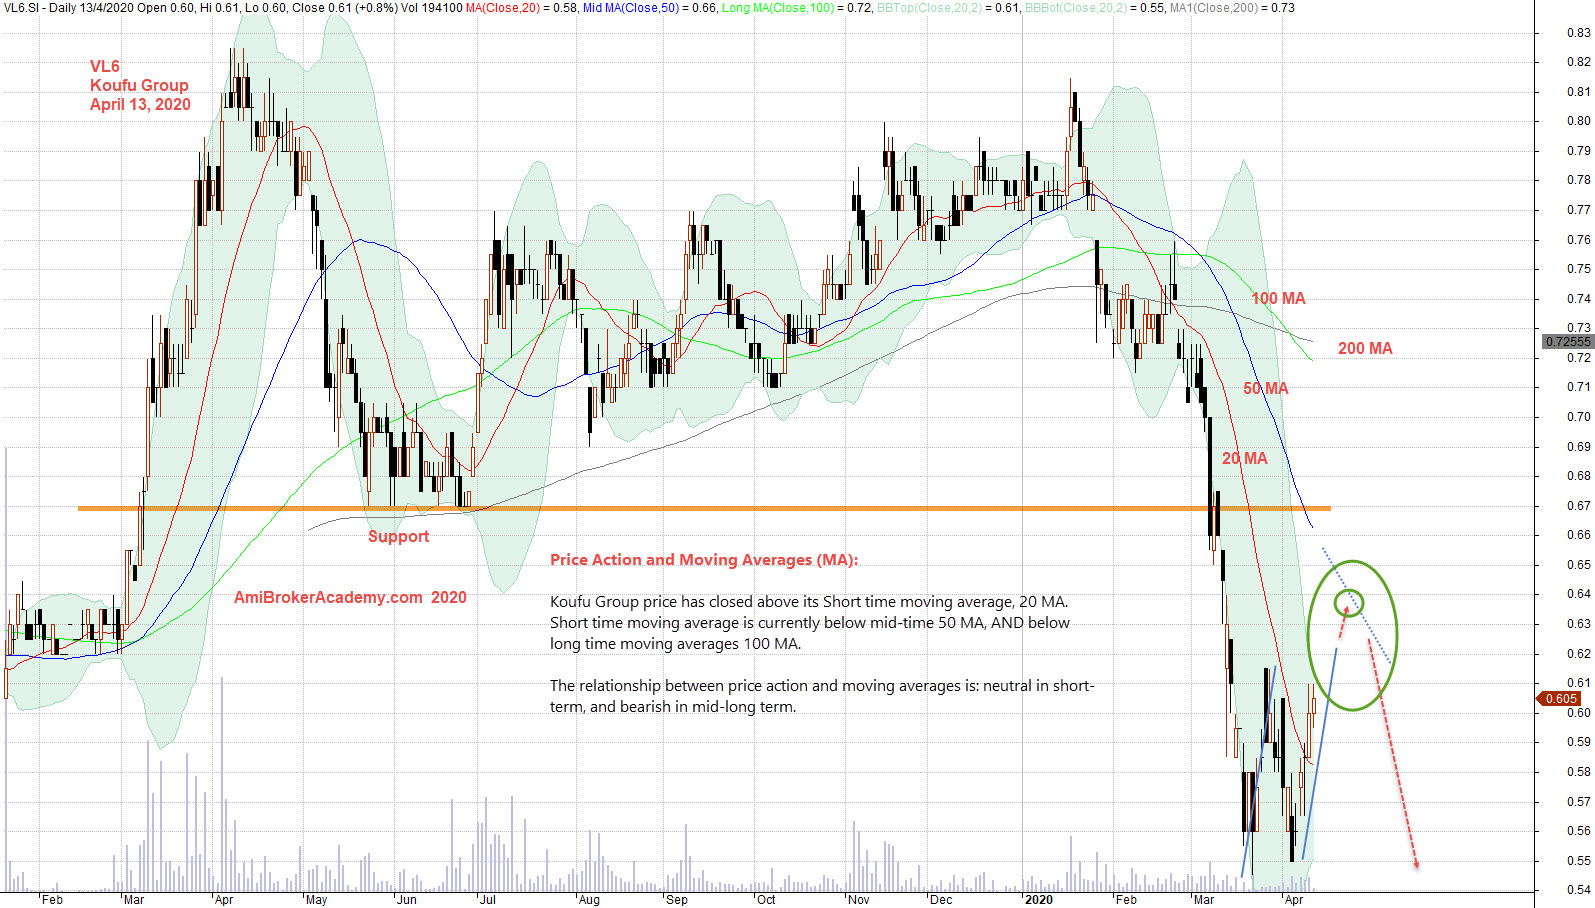
VL6 Koufu Group口福集团 Daily Stock Charting
Study Koufu Group 口福集团 Stock daily chart and price action.
Look left and think right. Manage your expectation.
See chart, picture worth a thousand words.
Moving Averages is a great visual tool for trading. Bull bias when price action above Moving Average and Bear when price action below ma.
Bull trend when price action keeps forming higher low, and tested higher high. See price action between last July till 2020 January.
Bear trend when price action begin to close below trendline, and stay below. Confirmed by the moving averages are slopping down.
Trade what you see manage your risk
Think Think Got More Things
Many guru has propose to buy. suggest that the bear market has ended. True or true?
They might be right! We wish them good luck.
From a support resistance perspective, the price action has not even cross over the previous support level, see chart. Wait it cross, pullback and test the support.
Remember to buy support and sell resistance
Moses Stock Observation
AmiBrokerAcademy.com
Disclaimer
The above result is for illustration purpose. It is not meant to be used for buy or sell decision. We do not recommend any particular stocks. If particular stocks of such are mentioned, they are meant as demonstration of Amibroker as a powerful charting software and MACD. Amibroker can program to scan the stocks for buy and sell signals.
These are script generated signals. Not all scan results are shown here. The MACD signal should use with price action. Users must understand what MACD and price action are all about before using them. If necessary you should attend a course to learn more on Technical Analysis (TA) and Moving Average Convergence Divergence, MACD.
Once again, the website does not guarantee any results or investment return based on the information and instruction you have read here. It should be used as learning aids only and if you decide to trade real money, all trading decision should be your own.