April 14 2020
Welcome to AmiBrokerAcademy.com. Thanks for visiting the site.
A glance at a chart with Moses. Hold no position and stay free.
Chart At A Glance
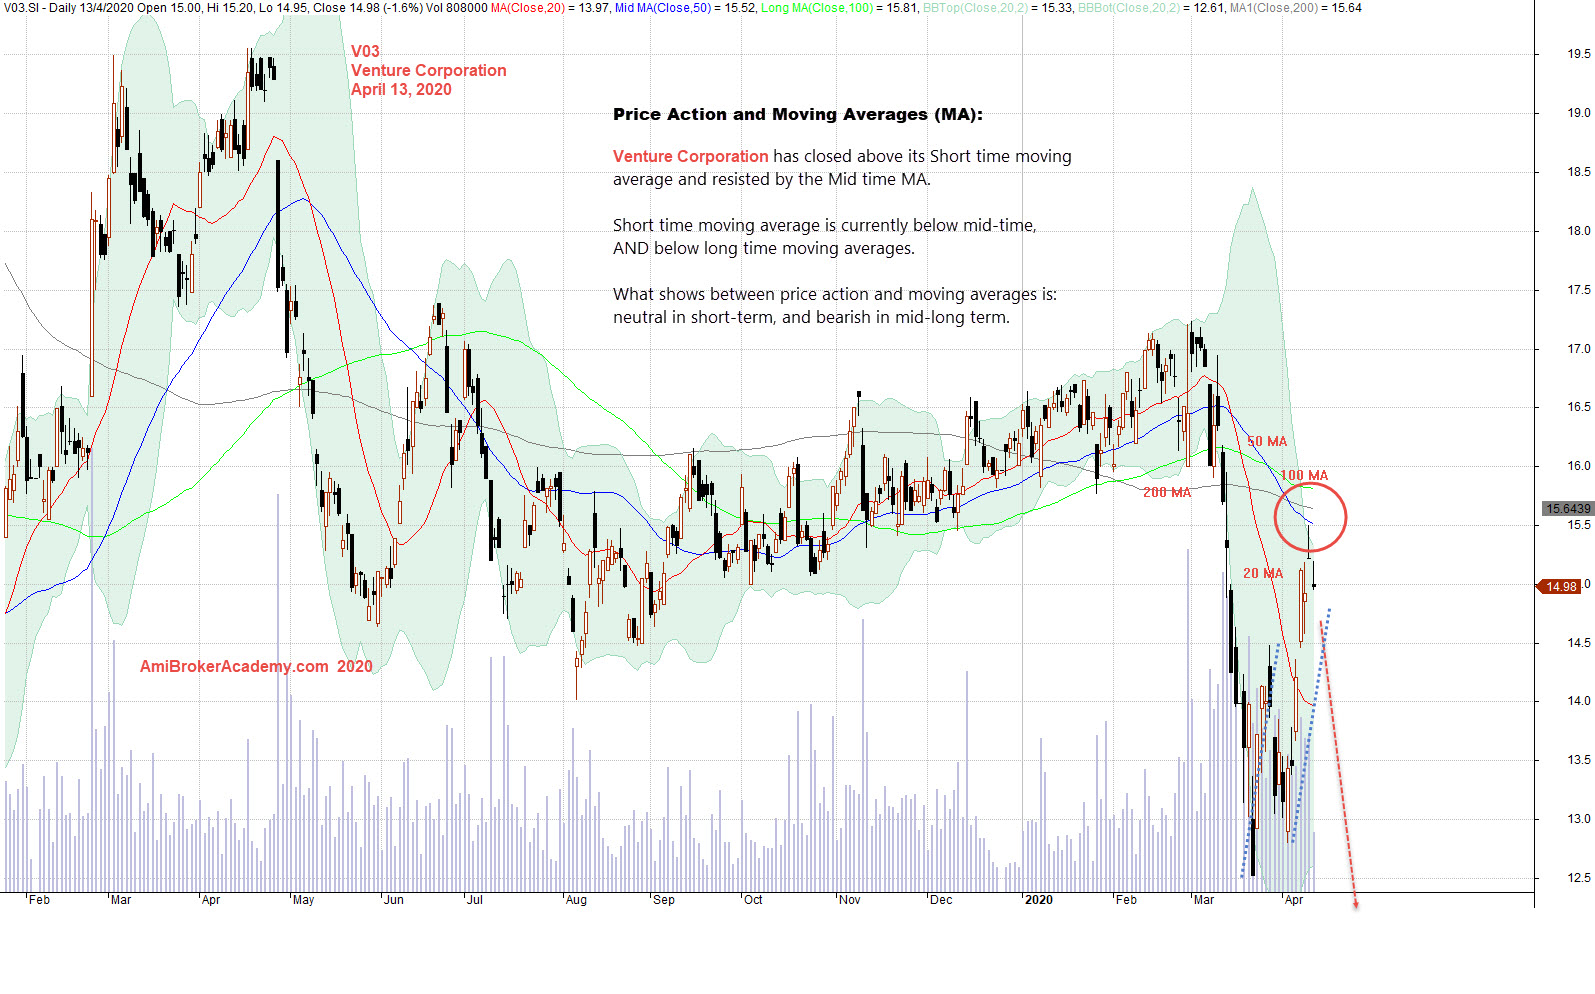
V03 Venture Corporation 风险投资公司 Daily Stock Charting
Study Venture Corporation 风险投资公司 Stock daily chart and price action.
Look left and think right. Manage your expectation.
See chart, picture worth a thousand words.
Moving Averages is a great visual tool for trading. Bull bias when price action above Moving Average and Bear when price action below ma.
Bull trend when price action keeps forming higher low, and tested higher high. See price action between last August till 2020 February.
Trade what you see manage your risk
Think Think Got More Things
Price Action has resisted by 50 MA, mid MA. Trade with eyes open.
Remember to buy support and sell resistance
Moses Stock Observation
AmiBrokerAcademy.com
Disclaimer
The above result is for illustration purpose. It is not meant to be used for buy or sell decision. We do not recommend any particular stocks. If particular stocks of such are mentioned, they are meant as demonstration of Amibroker as a powerful charting software and MACD. Amibroker can program to scan the stocks for buy and sell signals.
These are script generated signals. Not all scan results are shown here. The MACD signal should use with price action. Users must understand what MACD and price action are all about before using them. If necessary you should attend a course to learn more on Technical Analysis (TA) and Moving Average Convergence Divergence, MACD.
Once again, the website does not guarantee any results or investment return based on the information and instruction you have read here. It should be used as learning aids only and if you decide to trade real money, all trading decision should be your own.