January 2, 2019
Thanks for visiting the site, AmiBrokerAcademy.com.
^STI The Straits Times Index Charting
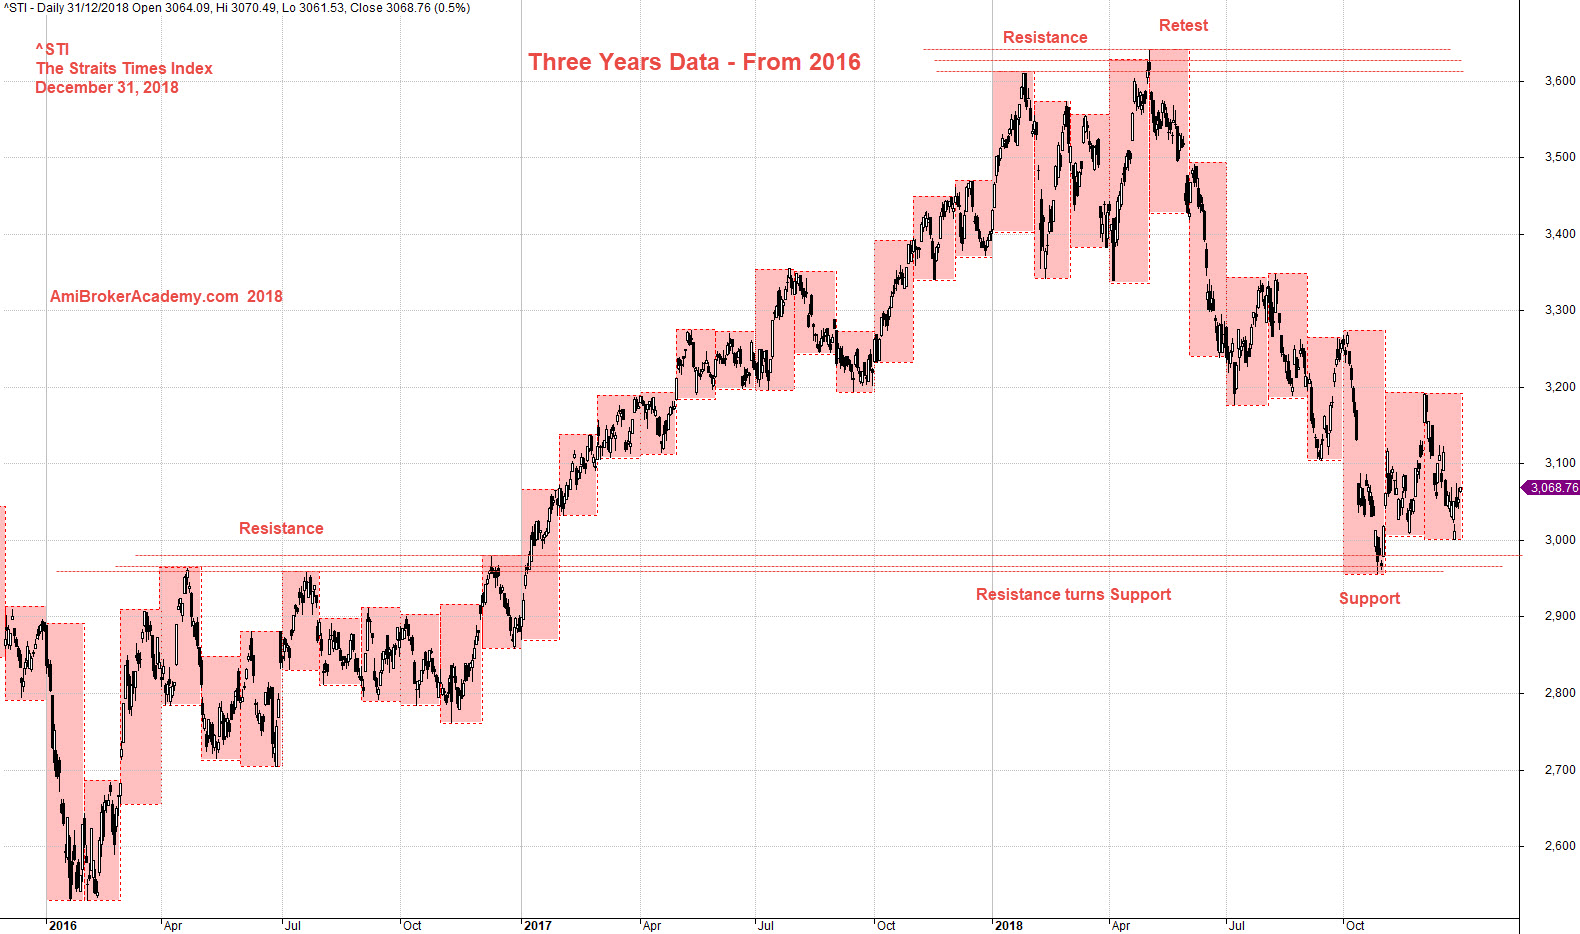
We study ST Index for three years, the data from 2016. We see the price action goes from the low in 2016 to the high in 2018. The price action retest the high in 2018 and the price action begin the drift south.
The resistance turn support, the price action low test the resistance of 2016.
Trade with eyes open.
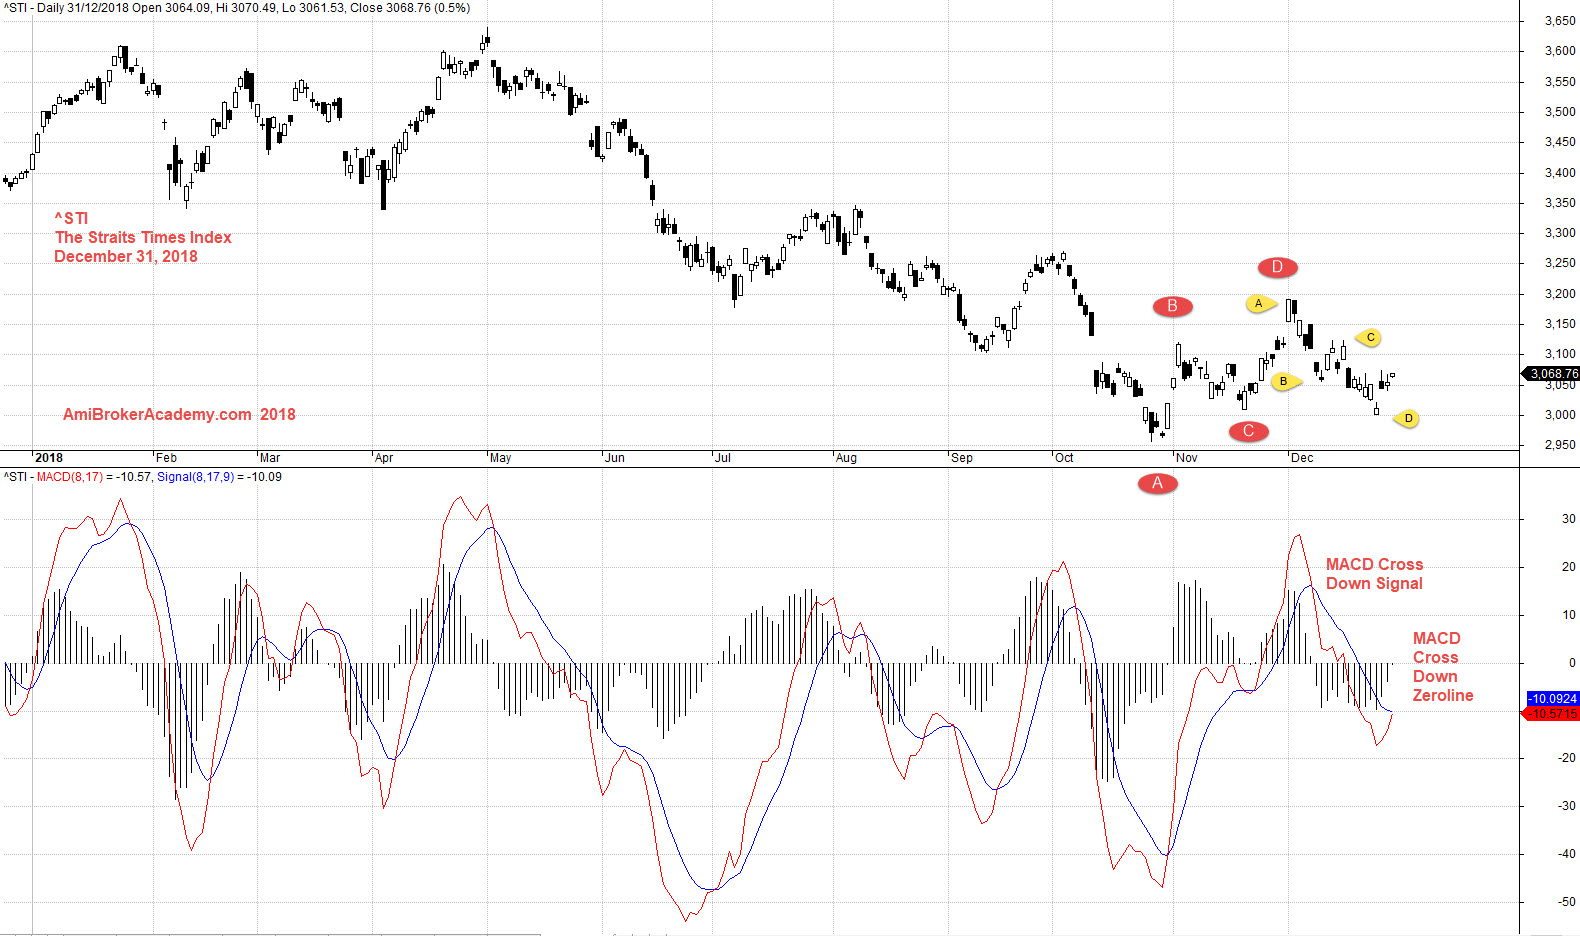
Add MACD indicator, and see the price action trend.
Moses US Stock Chart Analysis
AmiBrokerAcademy.com
Disclaimer
The above result is for illustration purpose. It is not meant to be used for buy or sell decision. We do not recommend any particular stocks. If particular stocks of such are mentioned, they are meant as demonstration of Amibroker as a powerful charting software and MACD. Amibroker can program to scan the stocks for buy and sell signals.
These are script generated signals. Not all scan results are shown here. The MACD signal should use with price action. Users must understand what MACD and price action are all about before using them. If necessary you should attend a course to learn more on Technical Analysis (TA) and Moving Average Convergence Divergence, MACD.
Once again, the website does not guarantee any results or investment return based on the information and instruction you have read here. It should be used as learning aids only and if you decide to trade real money, all trading decision should be your own.