December 21, 2018
Think think got more things.
Thanks for visiting the site.
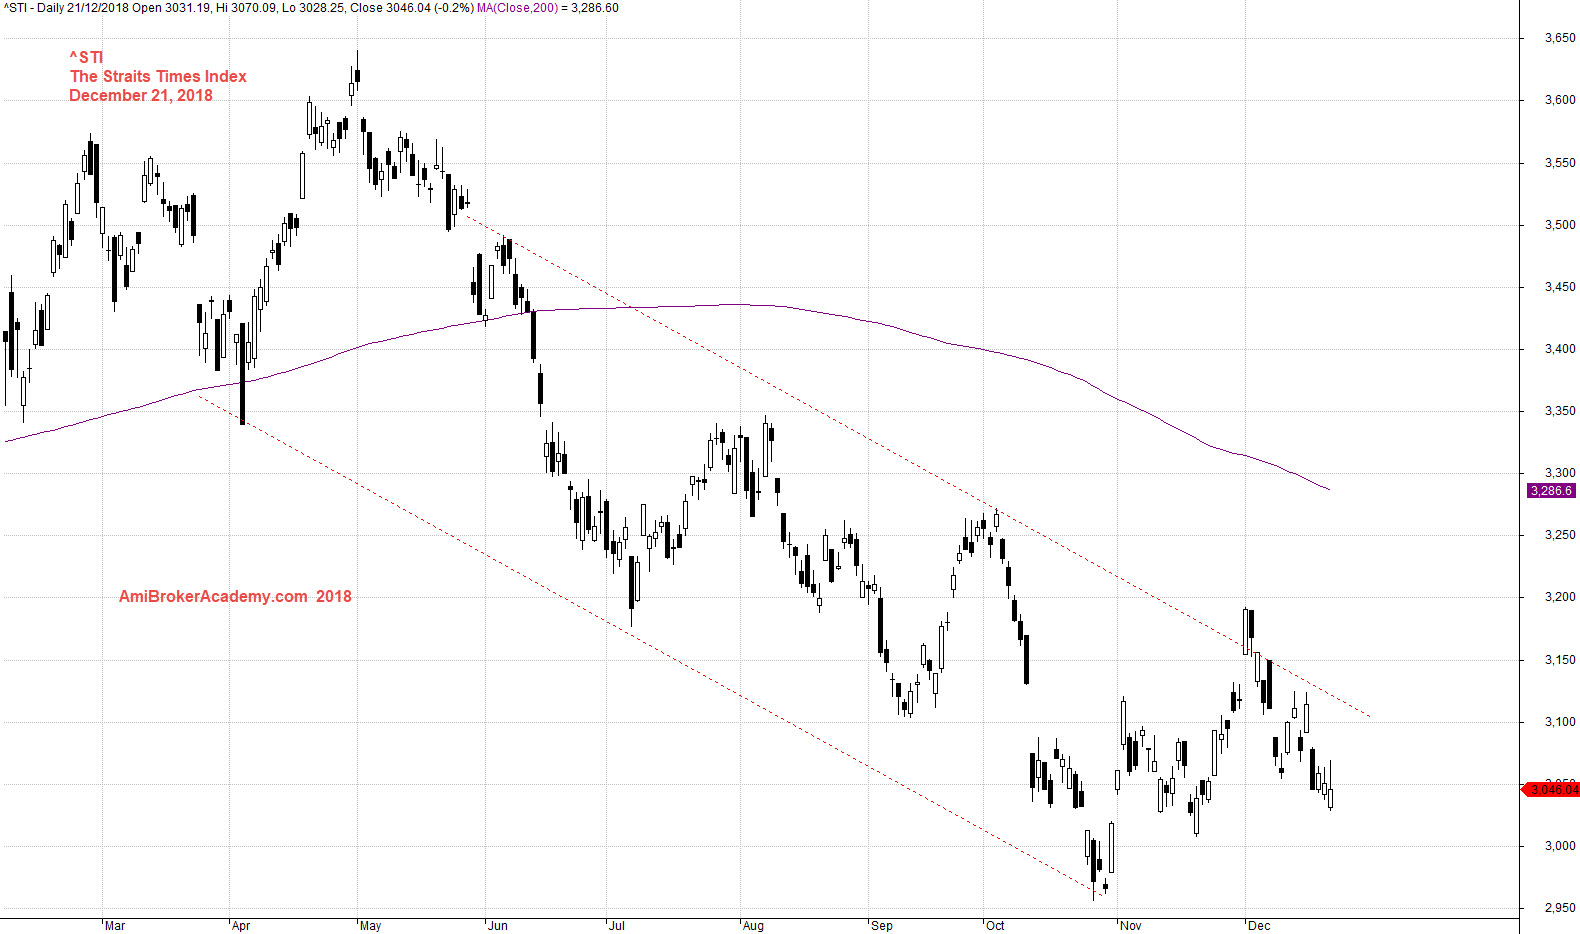
^STI Straits Times Index Charting
Channel is a very powerful tool. The price action trapped within channel. As long as the price action still within the channel, you know where will the price action travel.
Price action when breakout away from the upper or lower level, you know the price action will be travel away.
Trade with your eyes open.
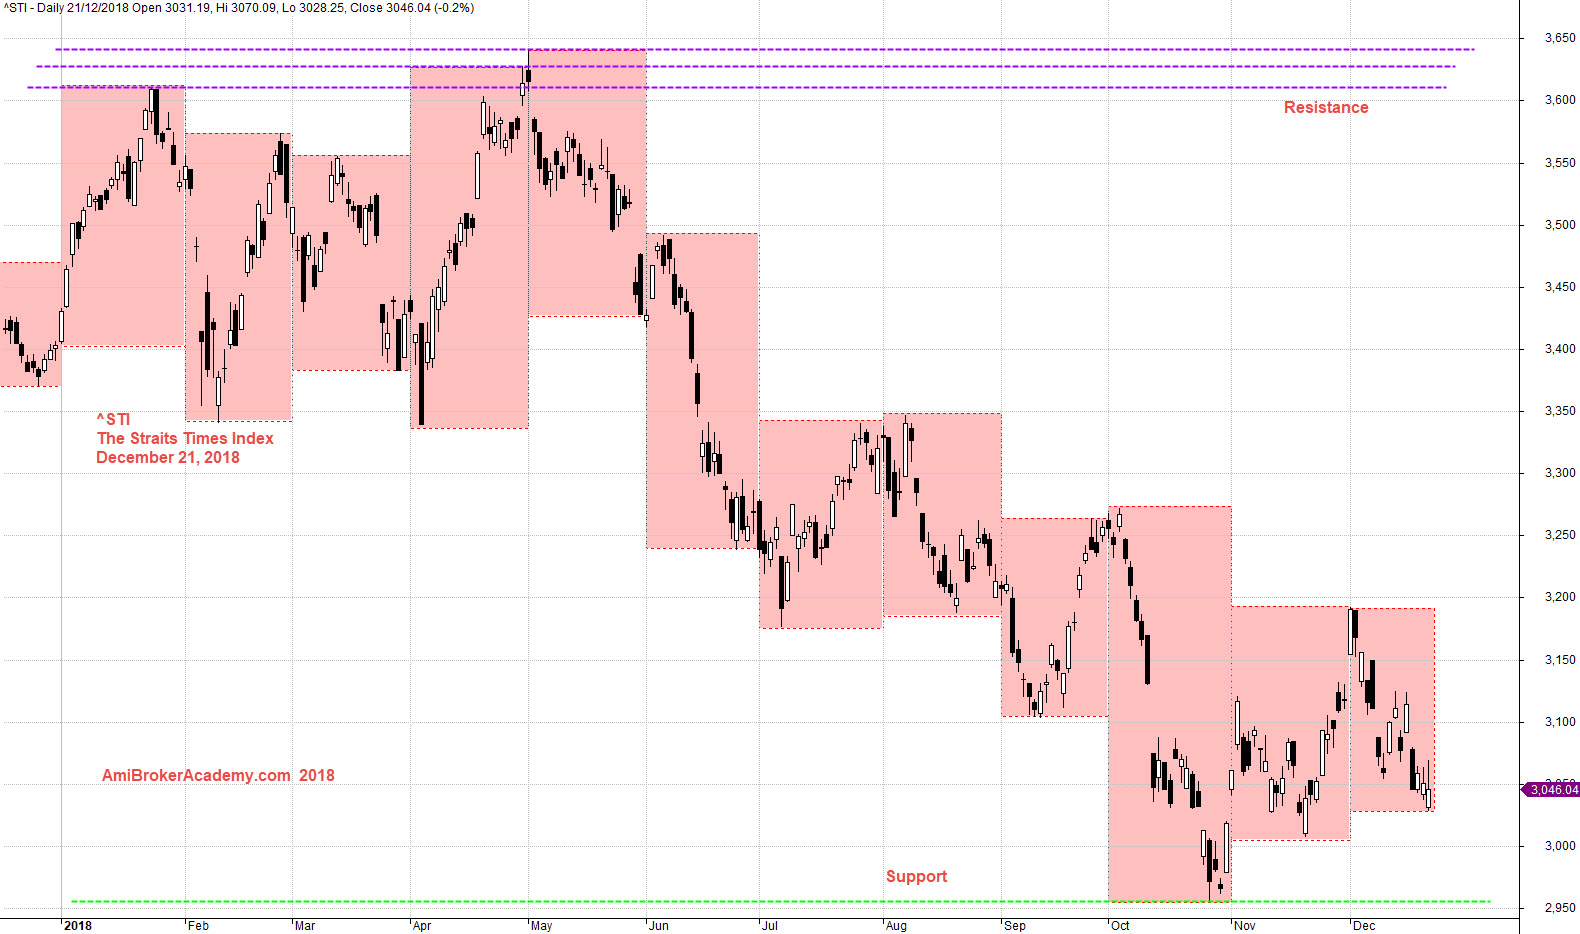
if you can see the full chart, “press Ctrl and -” to zoom out and see the entire chart.
From the box, the month high and low, we could easily identify the resistance and support in this chart. In this case, we see the resistance and support for 2018.
You can be sure, the price is trapped within these support and resistance.
Trade with your eyes open.
Moses US Stock Chart Analysis
AmiBrokerAcademy.com
Disclaimer
The above result is for illustration purpose. It is not meant to be used for buy or sell decision. We do not recommend any particular stocks. If particular stocks of such are mentioned, they are meant as demonstration of Amibroker as a powerful charting software and MACD. Amibroker can program to scan the stocks for buy and sell signals.
These are script generated signals. Not all scan results are shown here. The MACD signal should use with price action. Users must understand what MACD and price action are all about before using them. If necessary you should attend a course to learn more on Technical Analysis (TA) and Moving Average Convergence Divergence, MACD.
Once again, the website does not guarantee any results or investment return based on the information and instruction you have read here. It should be used as learning aids only and if you decide to trade real money, all trading decision should be your own.