12 September, 2018
Singapore Stock Stories
Thanks for visiting the site.
O39 Oversea-Chinese Banking Corporation OCBC Charting
Study Support Resistance
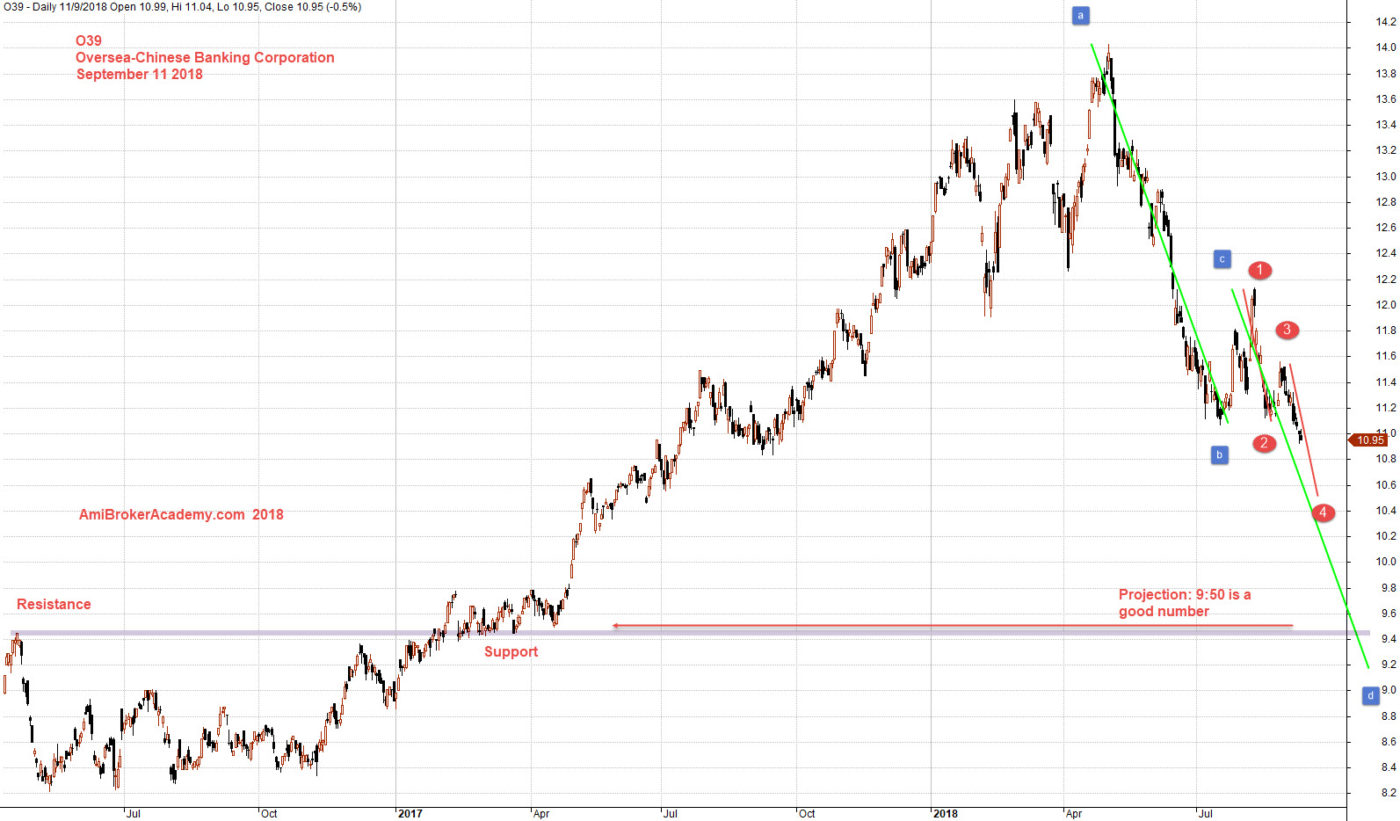
To maximize your profit and minimize risk is to buy low sell high, or in other words, buy support sell resistance.
Study Oversea-Chinese Banking Corporation stock price. Use buy support sell resistance strategy. Remember to take profit when the price action breakout below the bullish trend line. See chart picture worth a thousand words.
Stock price after 14 dollars and begin to fail. The price action almost hit 11 dollars from 14 dollars. The price action rebounce up to above 12 dollars. In fact, if you will study the chart carefully. You can easily see a bullish ABCD pattern. This is a sell ABCD pattern, at the end of the CD leg. The price action begin to fail again. We see the price action complete another ABCD pattern. See chart, picture worth a thousand words. If you step back you will notice the bear trend in fact, s the CD leg of the AB from 14 dollars. Take your time to read the chart.
Trade with eyes open.
Manage your risk.
September 11, 2018 Oversea-Chinese Banking and ABCD
To understand a stock better, if you could see the chart with more data. Let’s study OCBC stock from 2010, check the support resistance. You may notice the price action now supported bear the resistance of the past. See chart, picture worth a thousand words.
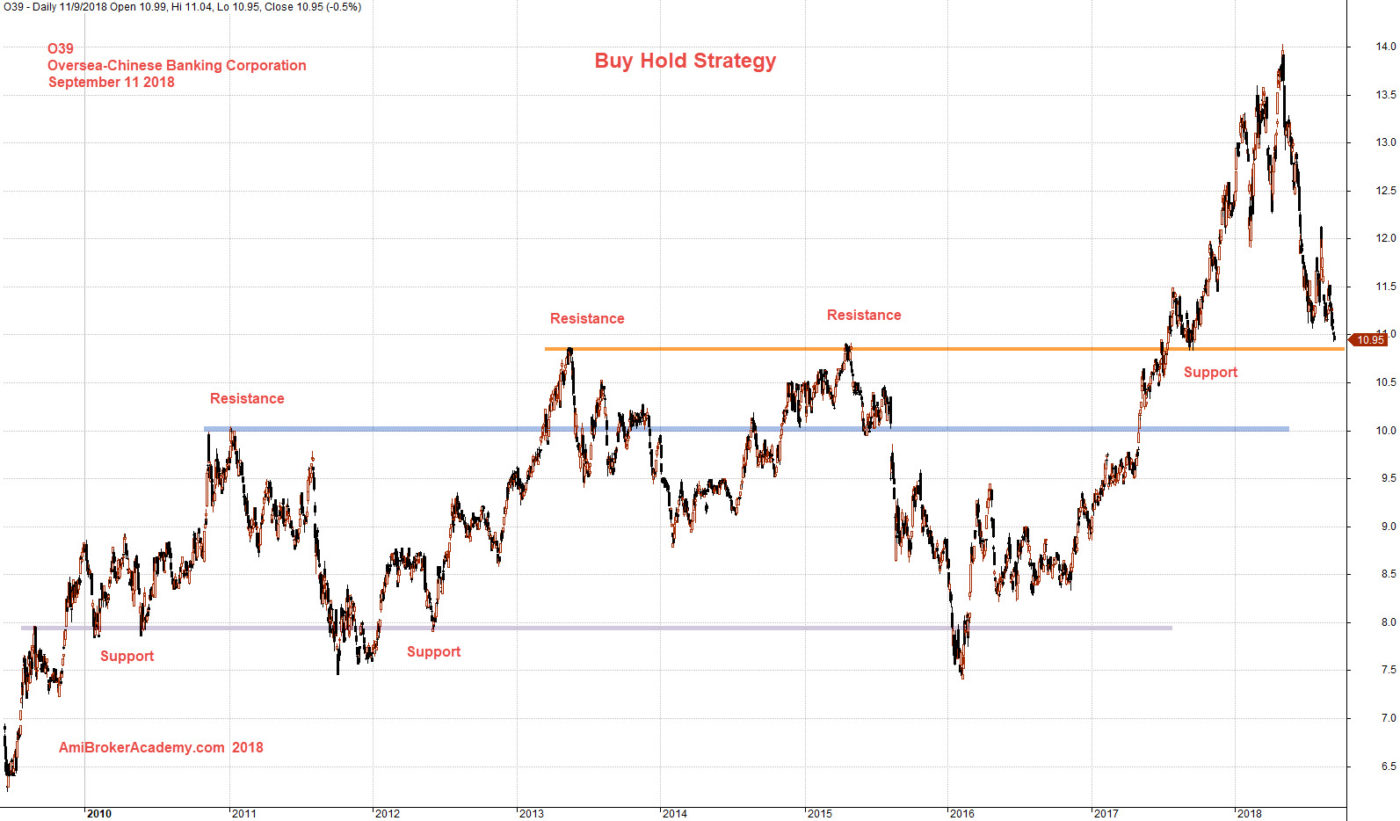
September 11, 2018 Oversea-Chinese Banking Corporation Buy Hold Strategy
To find a entry, zoom in and add indicator like MACD. We could see price action and MACD signal correlation. Trade with eyes open. Manage your risk.
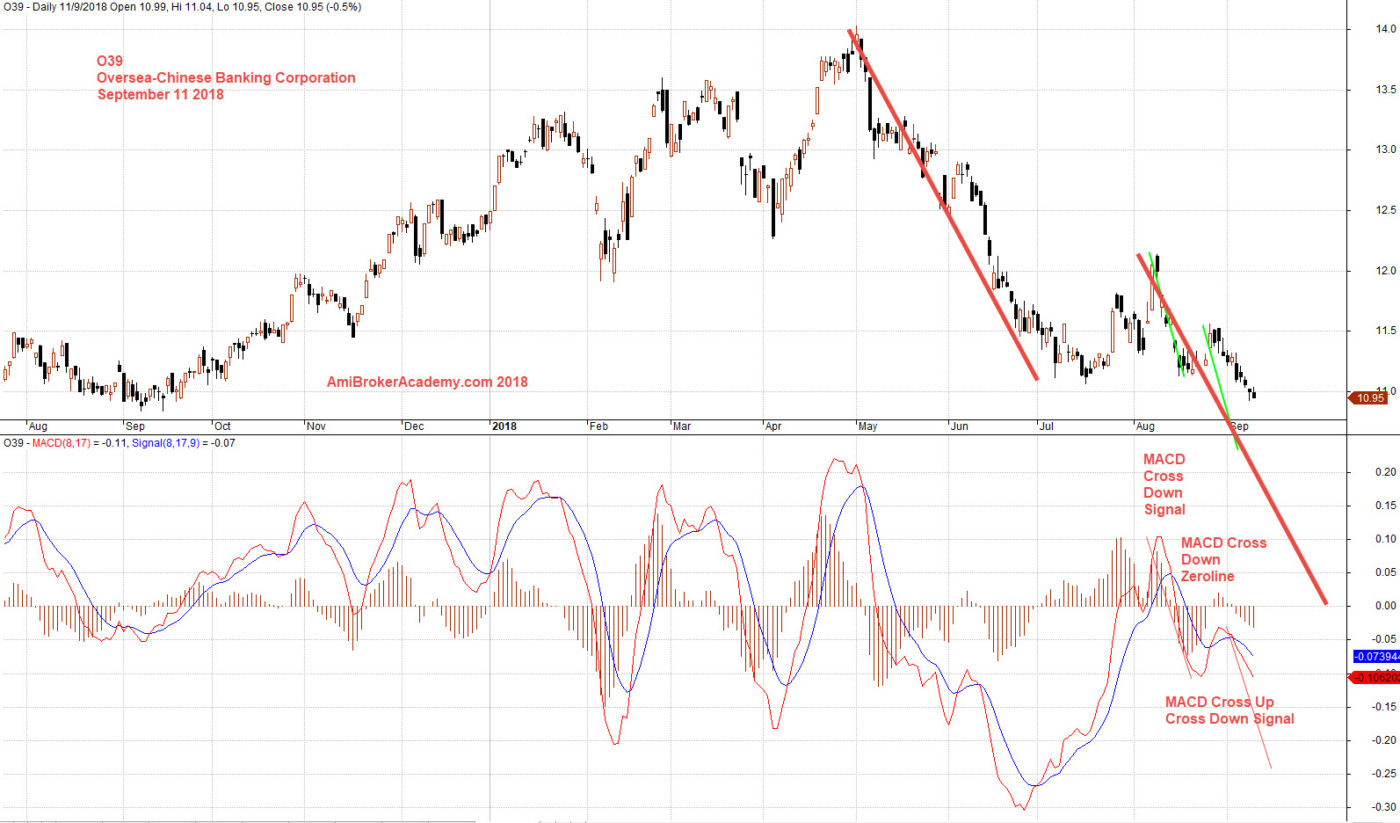
September 11, 2018 Oversea-Chinese Banking and MACD
Moses
AmiBrokerAcademy.com – we are different
Disclaimer
The above result is for illustration purpose. It is not meant to be used for buy or sell decision. We do not recommend any particular stocks. If particular stocks of such are mentioned, they are meant as demonstration of Amibroker as a powerful charting software and MACD. Amibroker can program to scan the stocks for buy and sell signals.
These are script generated signals. Not all scan results are shown here. The MACD signal should use with price action. Users must understand what MACD and price action are all about before using them. If necessary you should attend a course to learn more on Technical Analysis (TA) and Moving Average Convergence Divergence, MACD.
Once again, the website does not guarantee any results or investment return based on the information and instruction you have read here. It should be used as learning aids only and if you decide to trade real money, all trading decision should be your own.