September 12, 2018
Thanks for visiting the site.
Free U.S. Stock MACD Scan
What is MACD?
MACD stands for Moving Average Convergence Divergence, common setting is (12,26,9)
MACD indicator is a trend trading system that makes up of 2 lines. The MACD Line (fast line) and MACD Signal Line (slow line).
1) When the MACD Line crosses over the MACD Signal Line the trend is bullish. When the MACD Line crosses below the MACD Signal the trend is bearish.
2) When the MACD Line crosses above zero line the trend is bullish. When the MACD line crosses below zero line the trend is bearish.
Example of MACD Signal – ConAgra Brands Inc
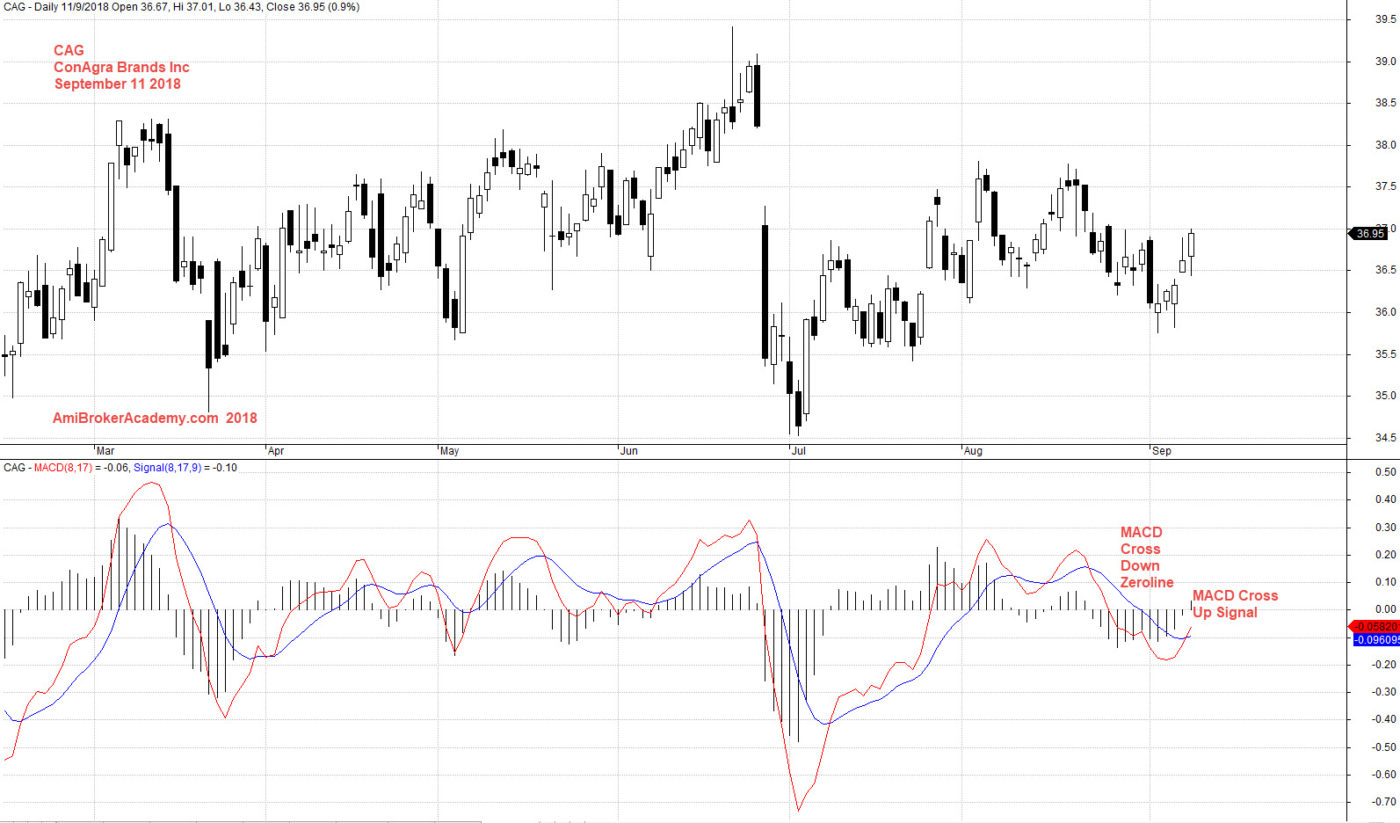
September 11, 2018 ConAgra Brands Inc and MACD
September 11 2018 – Script Generated One-day U.S. Stock MACD Signals
The following are script generated One-day U.S. Stock Market MACD signals using the Powerful AmiBroker’s AFL.
The MACD Setting used is (8,17,9)
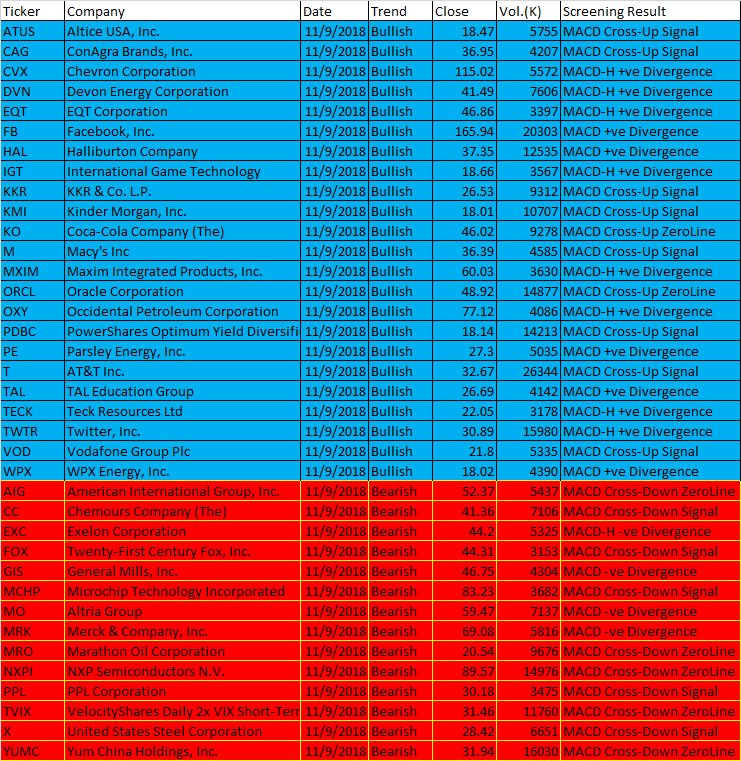
September 2018 11 US Stock One-day MACD Signals
| Ticker | Company | Date | Trend | Close | Vol.(K) | Screening Result |
| ATUS | Altice USA, Inc. | 11/9/2018 | Bullish | 18.47 | 5755 | MACD Cross-Up Signal |
| CAG | ConAgra Brands, Inc. | 11/9/2018 | Bullish | 36.95 | 4207 | MACD Cross-Up Signal |
| CVX | Chevron Corporation | 11/9/2018 | Bullish | 115.02 | 5572 | MACD-H +ve Divergence |
| DVN | Devon Energy Corporation | 11/9/2018 | Bullish | 41.49 | 7606 | MACD-H +ve Divergence |
| EQT | EQT Corporation | 11/9/2018 | Bullish | 46.86 | 3397 | MACD-H +ve Divergence |
| FB | Facebook, Inc. | 11/9/2018 | Bullish | 165.94 | 20303 | MACD +ve Divergence |
| HAL | Halliburton Company | 11/9/2018 | Bullish | 37.35 | 12535 | MACD +ve Divergence |
| IGT | International Game Technology | 11/9/2018 | Bullish | 18.66 | 3567 | MACD-H +ve Divergence |
| KKR | KKR & Co. L.P. | 11/9/2018 | Bullish | 26.53 | 9312 | MACD Cross-Up Signal |
| KMI | Kinder Morgan, Inc. | 11/9/2018 | Bullish | 18.01 | 10707 | MACD Cross-Up Signal |
| KO | Coca-Cola Company (The) | 11/9/2018 | Bullish | 46.02 | 9278 | MACD Cross-Up ZeroLine |
| M | Macy’s Inc | 11/9/2018 | Bullish | 36.39 | 4585 | MACD Cross-Up Signal |
| MXIM | Maxim Integrated Products, Inc. | 11/9/2018 | Bullish | 60.03 | 3630 | MACD-H +ve Divergence |
| ORCL | Oracle Corporation | 11/9/2018 | Bullish | 48.92 | 14877 | MACD Cross-Up ZeroLine |
| OXY | Occidental Petroleum Corporation | 11/9/2018 | Bullish | 77.12 | 4086 | MACD-H +ve Divergence |
| PDBC | PowerShares Optimum Yield Diversified Commodity Strategy No K- | 11/9/2018 | Bullish | 18.14 | 14213 | MACD Cross-Up Signal |
| PE | Parsley Energy, Inc. | 11/9/2018 | Bullish | 27.3 | 5035 | MACD +ve Divergence |
| T | AT&T Inc. | 11/9/2018 | Bullish | 32.67 | 26344 | MACD Cross-Up Signal |
| TAL | TAL Education Group | 11/9/2018 | Bullish | 26.69 | 4142 | MACD +ve Divergence |
| TECK | Teck Resources Ltd | 11/9/2018 | Bullish | 22.05 | 3178 | MACD-H +ve Divergence |
| TWTR | Twitter, Inc. | 11/9/2018 | Bullish | 30.89 | 15980 | MACD-H +ve Divergence |
| VOD | Vodafone Group Plc | 11/9/2018 | Bullish | 21.8 | 5335 | MACD Cross-Up Signal |
| WPX | WPX Energy, Inc. | 11/9/2018 | Bullish | 18.02 | 4390 | MACD +ve Divergence |
| AIG | American International Group, Inc. | 11/9/2018 | Bearish | 52.37 | 5437 | MACD Cross-Down ZeroLine |
| CC | Chemours Company (The) | 11/9/2018 | Bearish | 41.36 | 7106 | MACD Cross-Down Signal |
| EXC | Exelon Corporation | 11/9/2018 | Bearish | 44.2 | 5325 | MACD-H -ve Divergence |
| FOX | Twenty-First Century Fox, Inc. | 11/9/2018 | Bearish | 44.31 | 3153 | MACD Cross-Down Signal |
| GIS | General Mills, Inc. | 11/9/2018 | Bearish | 46.75 | 4304 | MACD -ve Divergence |
| MCHP | Microchip Technology Incorporated | 11/9/2018 | Bearish | 83.23 | 3682 | MACD Cross-Down Signal |
| MO | Altria Group | 11/9/2018 | Bearish | 59.47 | 7137 | MACD -ve Divergence |
| MRK | Merck & Company, Inc. | 11/9/2018 | Bearish | 69.08 | 5816 | MACD -ve Divergence |
| MRO | Marathon Oil Corporation | 11/9/2018 | Bearish | 20.54 | 9676 | MACD Cross-Down ZeroLine |
| NXPI | NXP Semiconductors N.V. | 11/9/2018 | Bearish | 89.57 | 14976 | MACD Cross-Down ZeroLine |
| PPL | PPL Corporation | 11/9/2018 | Bearish | 30.18 | 3475 | MACD Cross-Down Signal |
| TVIX | VelocityShares Daily 2x VIX Short-Term ETN | 11/9/2018 | Bearish | 31.46 | 11760 | MACD Cross-Down ZeroLine |
| X | United States Steel Corporation | 11/9/2018 | Bearish | 28.42 | 6651 | MACD Cross-Down Signal |
| YUMC | Yum China Holdings, Inc. | 11/9/2018 | Bearish | 31.94 | 16030 | MACD Cross-Down ZeroLine |
Moses U.S. Stock MACD Scan
AmiBroker Academy.com
Disclaimer
The above result is for illustration purpose. It is not meant to be used for buy or sell decision. We do not recommend any particular stocks. If particular stocks of such are mentioned, they are meant as demonstration of Amibroker as a powerful charting software and MACD. Amibroker can program to scan the stocks for buy and sell signals.
These are script generated signals. Not all scan results are shown here. The MACD signal should use with price action. Users must understand what MACD and price action are all about before using them. If necessary you should attend a course to learn more on Technical Analysis (TA) and Moving Average Convergence Divergence, MACD.
Once again, the website does not guarantee any results or investment return based on the information and instruction you have read here. It should be used as learning aids only and if you decide to trade real money, all trading decision should be your own.