May 6, 2018
Singapore Chart Stories
C31 Capitaland and MACD
Study C31 Capitaland using MACD. From chart, you see the price action moving zigzag. You could easily spotted many ABCD pattern, some has AB=CD, and some not. We could also spot divergence.
Manage your risk.
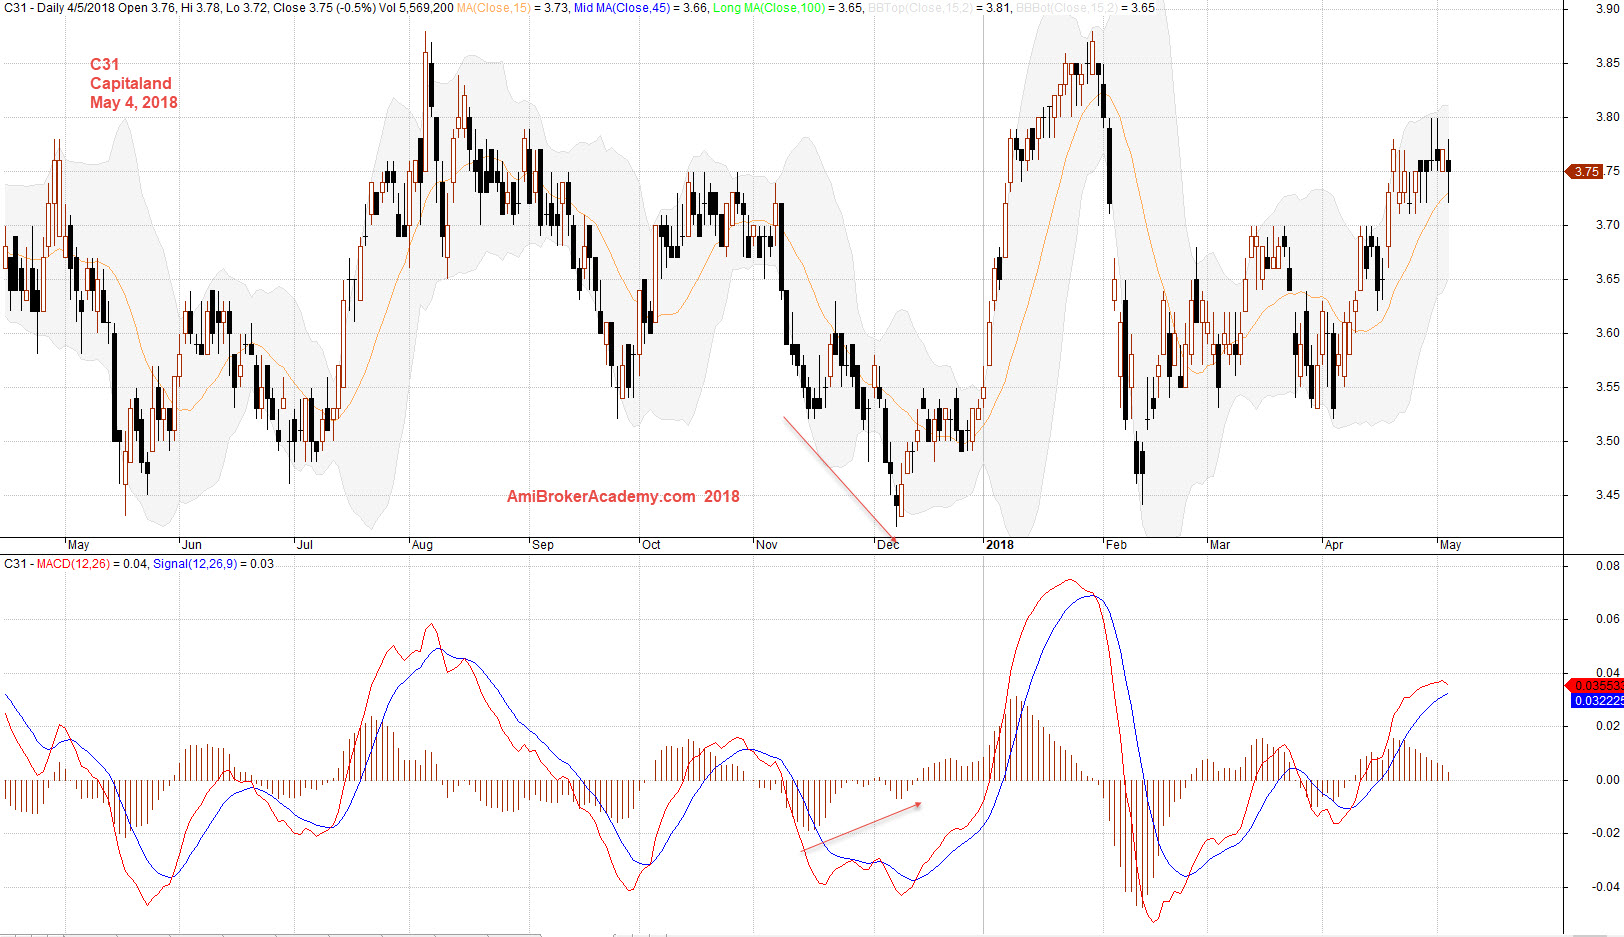
May 4, 2018 Capitaland and MACD
C31 Capitaland and Fibonacci
Study Capitaland using Fibonacci. We see a sideways from last April. Swing low to high, from the low of 2015 to a high of 2017. We see the the stock price repeatedly test the high, and many was trapped. Picture worth a thousand words. Manage your risk.
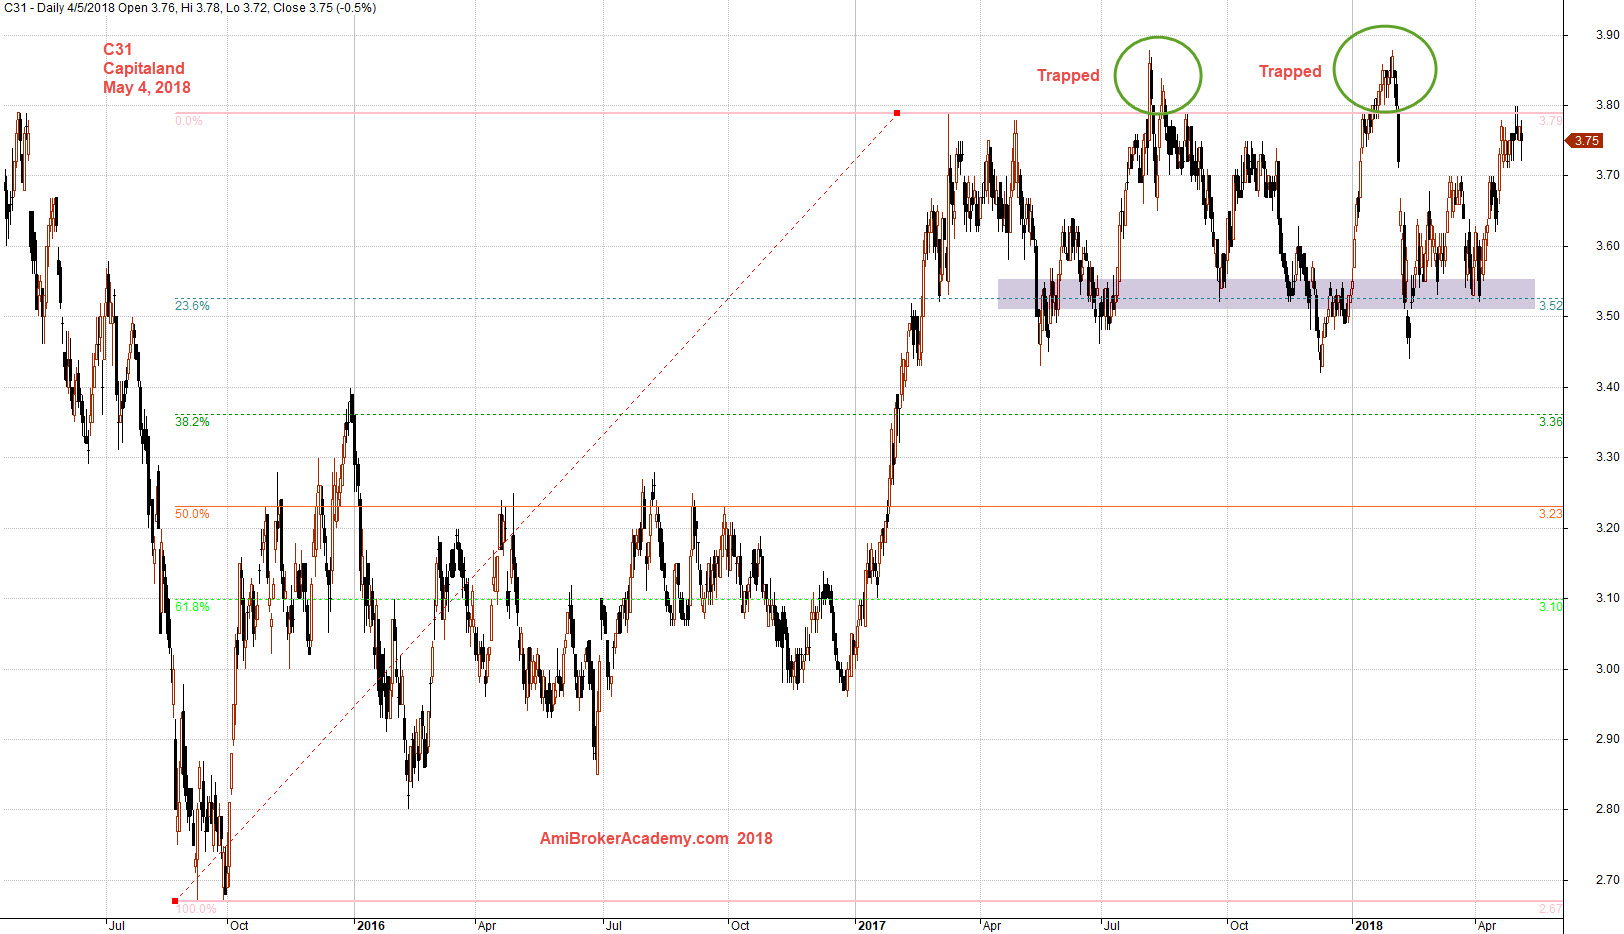
May 4, 2018 Capitaland and Fibo Low to High
Moses Singapore Stock Analysis
AmiBrokerAcademy.com
Disclaimer
The above result is for illustration purpose. It is not meant to be used for buy or sell decision. We do not recommend any particular stocks. If particular stocks of such are mentioned, they are meant as demonstration of Amibroker as a powerful charting software and MACD. Amibroker can program to scan the stocks for buy and sell signals.
These are script generated signals. Not all scan results are shown here. The MACD signal should use with price action. Users must understand what MACD and price action are all about before using them. If necessary you should attend a course to learn more on Technical Analysis (TA) and Moving Average Convergence Divergence, MACD.
Once again, the website does not guarantee any results or investment return based on the information and instruction you have read here. It should be used as learning aids only and if you decide to trade real money, all trading decision should be your own.