27 July 2021
Welcome!
Welcome to AmiBroker Academy dot com, amibrokeracademy.com.
Trading is all probability. You buy or sell from our observation.
Trading is all about observation, reading the price bar and not news. By the time you hear the news it is already old and become history. Why? It is very simple, remember where the news come from? It has first someone release to the news agency like CNBC, and so on. Next, someone has to read the news to you after some research and summarize. This will be few hours later, by then the price action has already done.
As for price bar, it is what the market supply and remand. When market feel that is over price, the price will drop. All this reflected on the price bar almost instantly.
Next is how to read our price bar plus using some tools, such as MACD.
Here, we simply translate price action chart into layman language. This will help you in understand the financial instrument you are trading. We believe picture worth a thousand words. So, sometimes we use less words. You can learn the price action interpretation too. Give it a tray. You may not have the same view points as us. Remember all analysis read price action chart differently. It is just like reading an essay, we will have different conclusion.
Trade well.
Trade what you see. Manage your risk.
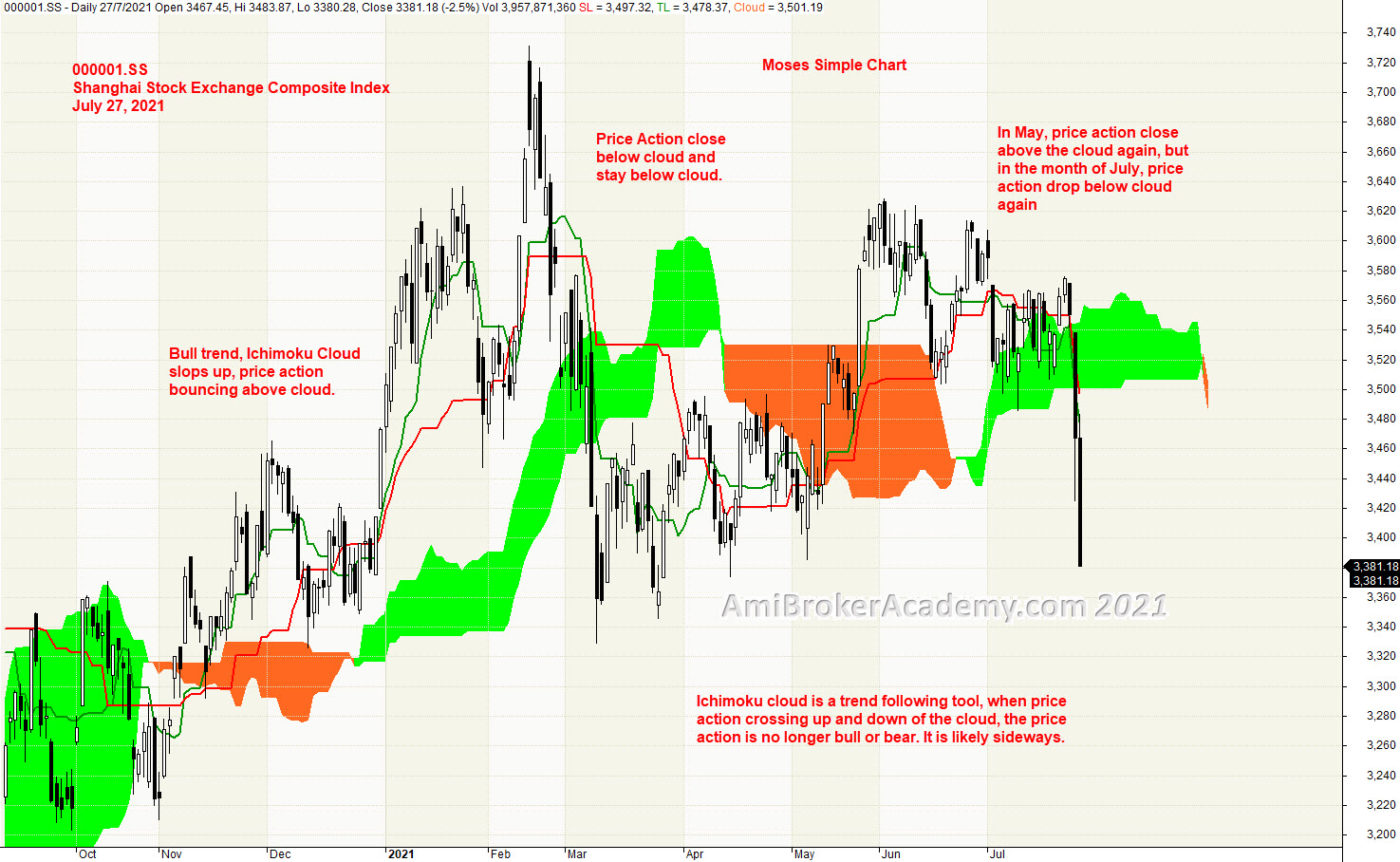
1) Shanghai Stock Exchange Composite Index and Ichimoku Cloud
Ichimoku Cloud is a good trend following strategy tool, can use in any market and any timeframe. You can also apply Ichimoku cloud on cryptocurrency chart. Ichimoku indicator emphasize to trade in the trend direction.
Price action goes from bottom left to the top of the chart. After February, the price action begin to pullback and sink into cloud and stay inside cloud. Remember, Ichimoku is a trend following tool, look like the current price action has broken Ichimoku capable off. So, when not sure, stand aside, wait for clearer trend.
Don’t play play with Ichimoku indicator. Very simple. Very powerful. AmiBrokerAcademy provides you simple and easy to understand charting. Check out more on Moses power stock chart.
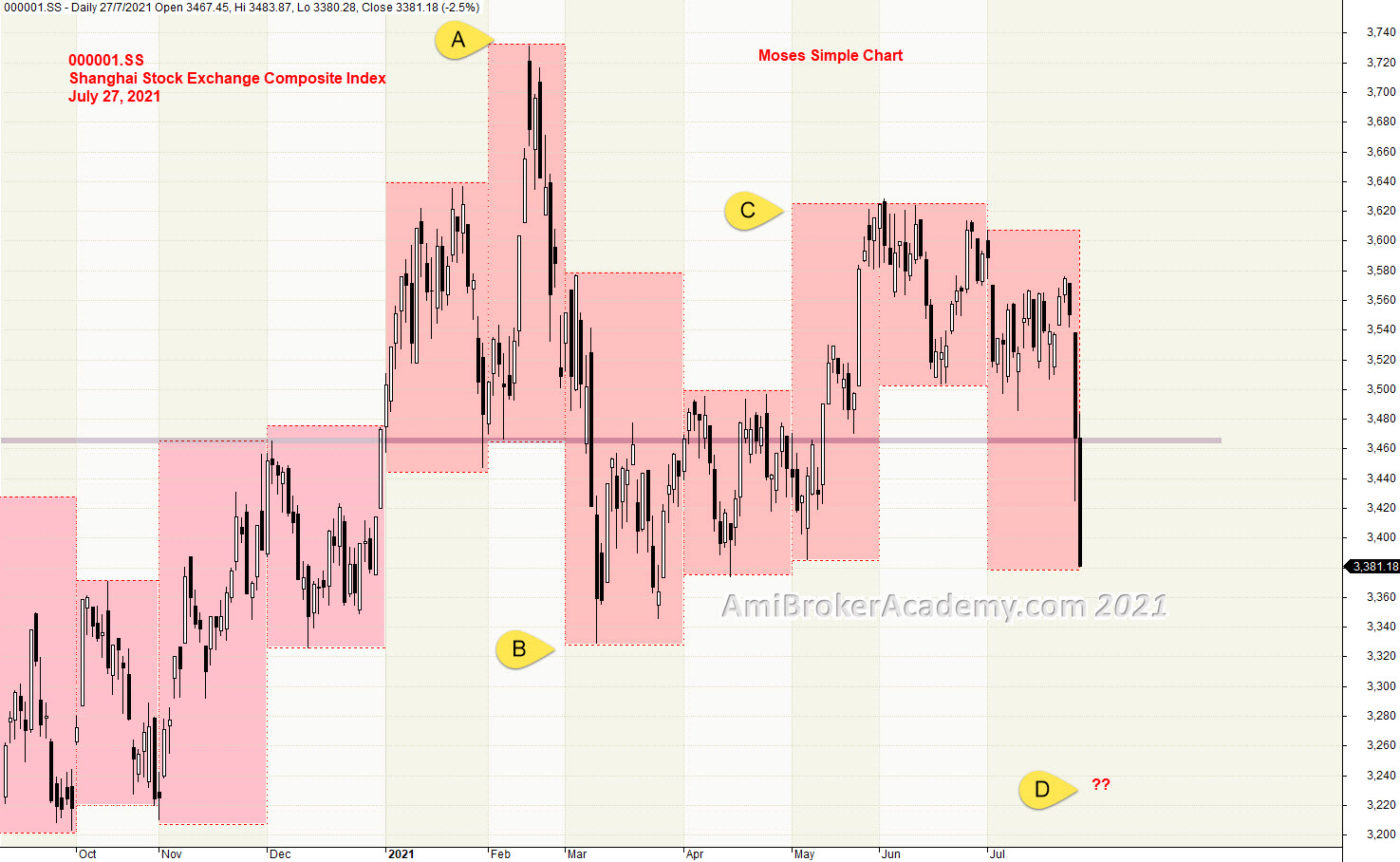
2) Shanghai Stock Exchange Composite Index and Support Resistance
Price Action goes from low to high and pullback. We use month high low to find a solid strong support resistance level. From box, and price action we see 3460 level is a strong level.
We could spot a potential ABCD patter. Now is in CD leg.
Have fun!
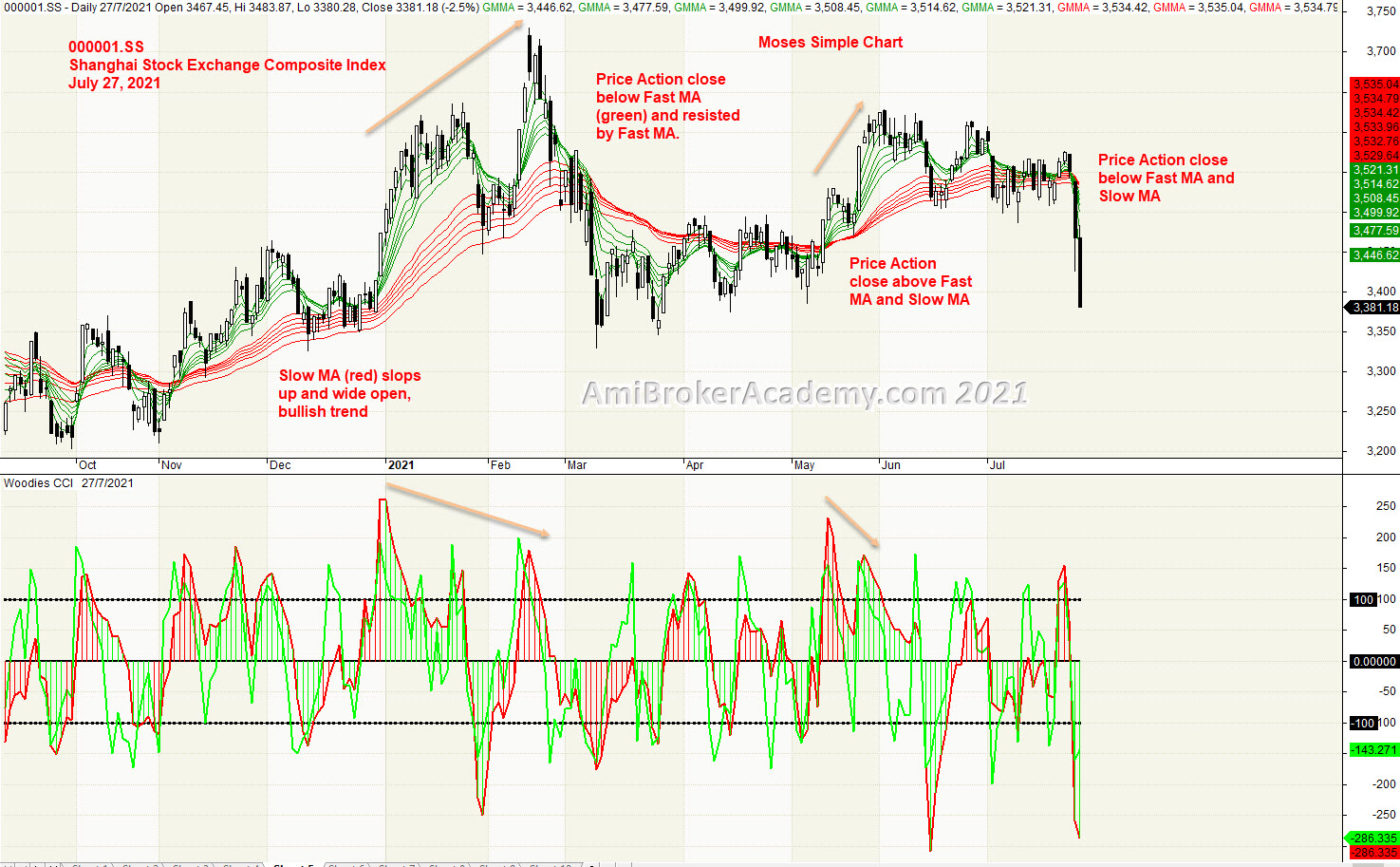
3) Shanghai Stock Exchange Composite Index and GMMA and Woodies CCI
When add GMMA, you could find the green belt go on top of red belt, and green belt start to sink below red in March. Green stay below red. Next, green goes above red. In July price action breakout below both Green and Red band. This is the beauty of GMMA, help you to find the bull and the bear trend.
Find low to buy when bull trend. Taking profit when price action get resisted.
Trade with eyes open.
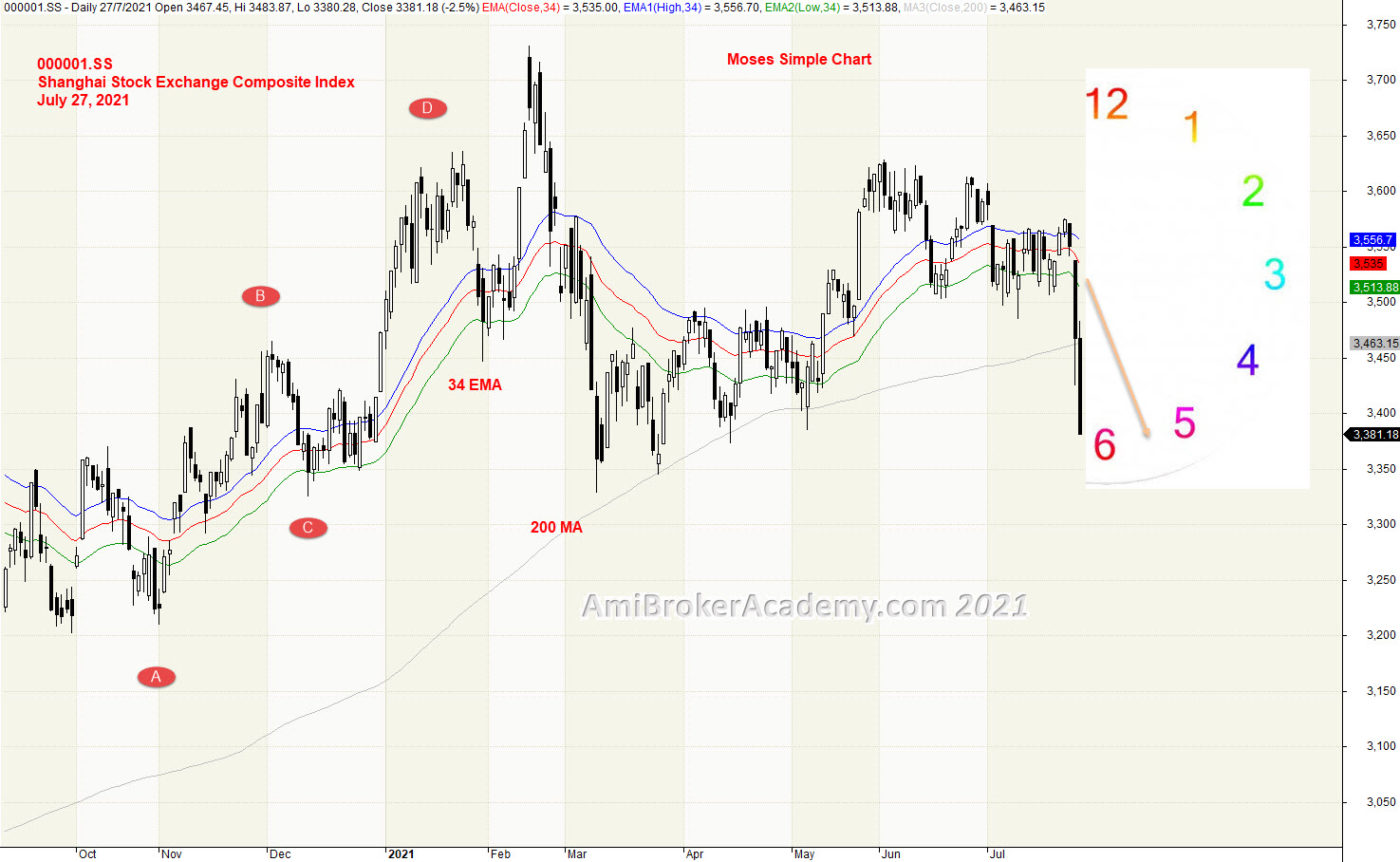
4) Shanghai Stock Exchange Composite Index and River
34 EMA slops up and above 200 MA, bull trend. Price Action should also stay above the River at this point. Raghee uses 34 EMA, high, low and close to see the wave direction,
Price Action crosses and closes below River, in March. Price Action try to breakout River but fail. Only until May price action breakout above River. But, shortly after the price breakout below River. River begin to go flat.
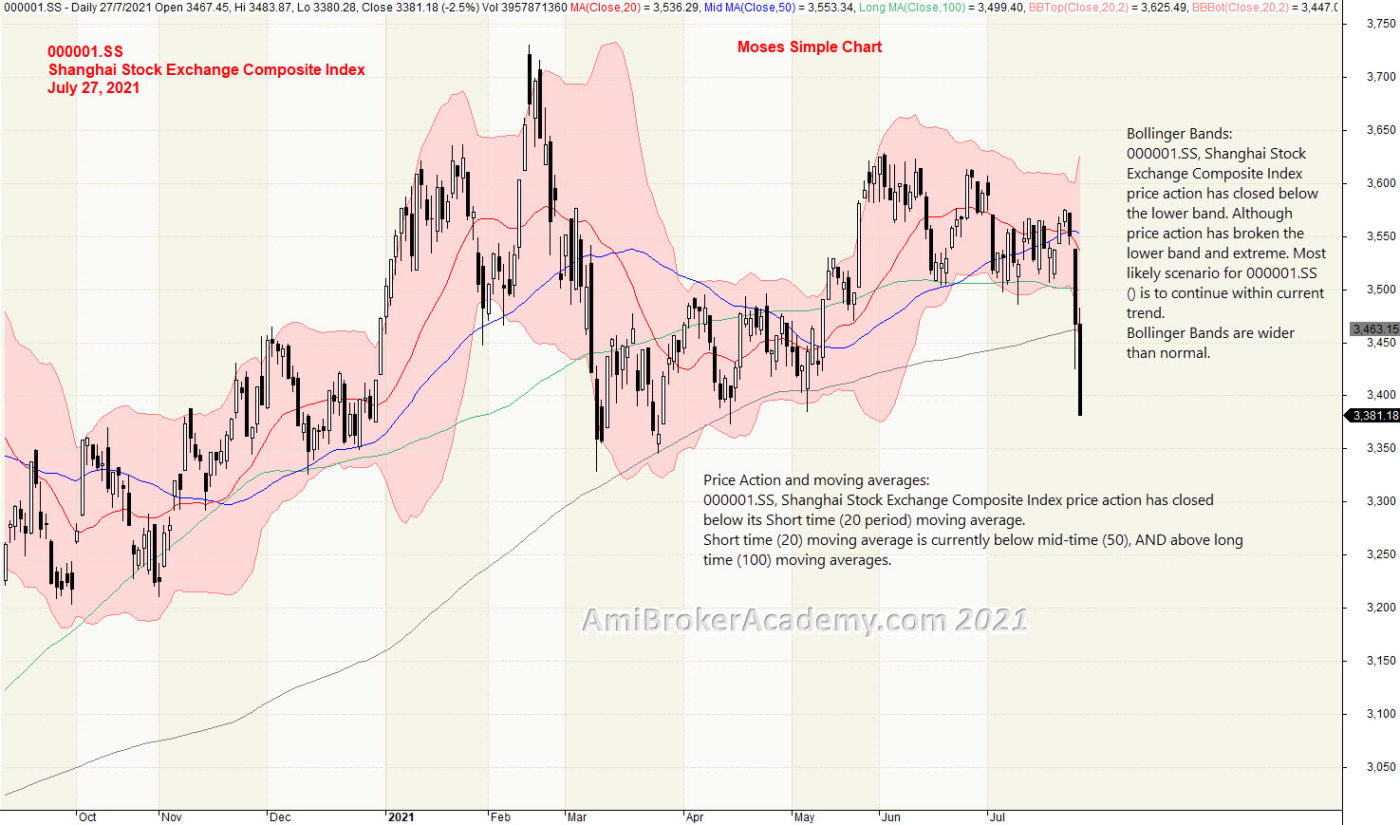
5) Shanghai Stock Exchange Composite Index and Bollinger Bands and Moving Averages
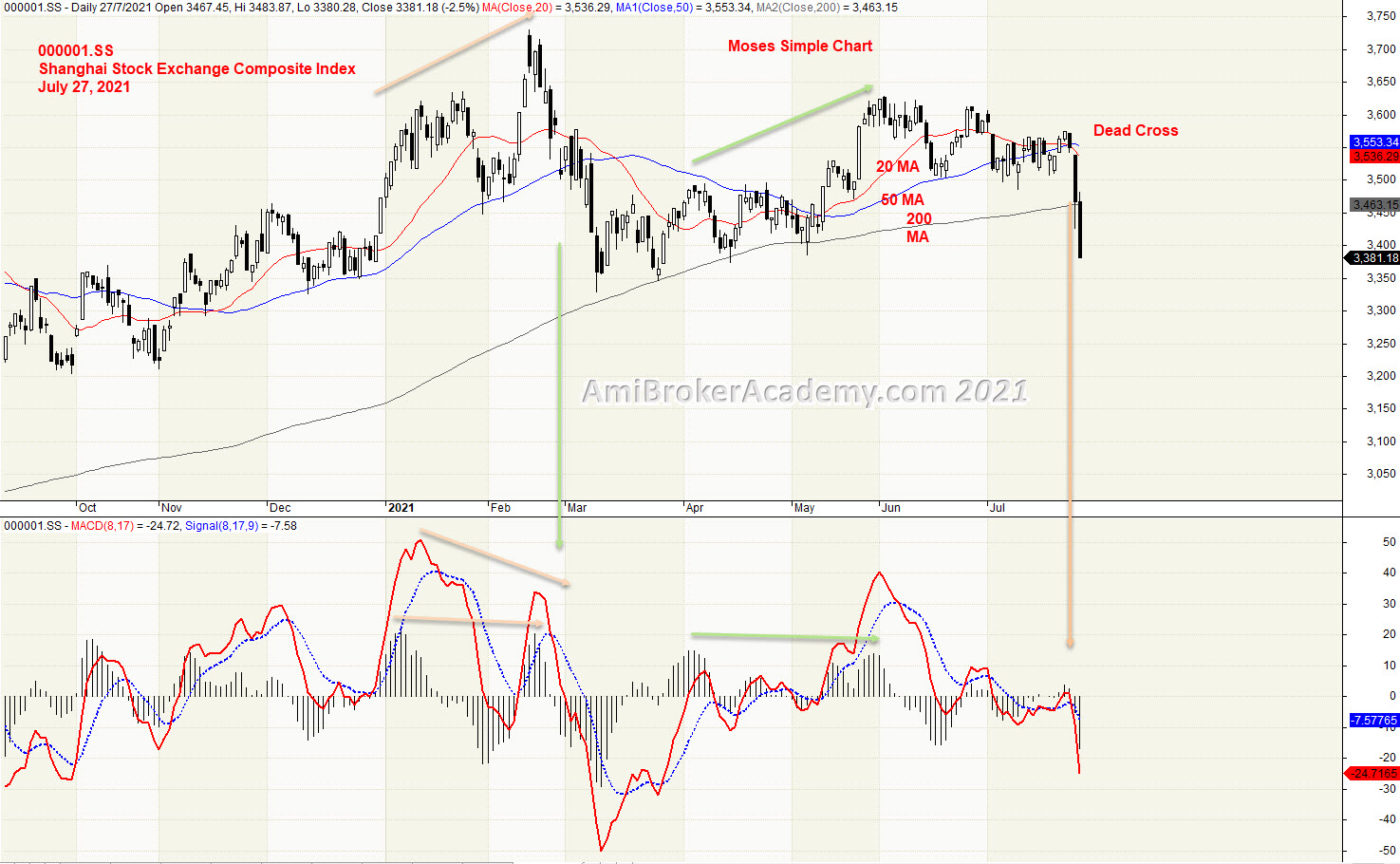
6) Shanghai Stock Exchange Composite Index and MACD
MACD is a simple yet powerful indicator. See price action react to MACD Divergence, MACD Cross Up or Down Signal. Don’t play play.
Moses Power Charting
Official AmiBrokerAcademy.com Charting
Disclaimer
The above result is for illustration purpose. It is not meant to be used for buy or sell decision. We do not recommend any particular stocks. If particular stocks of such are mentioned, they are meant as demonstration of Amibroker as a powerful charting software and MACD. Amibroker can program to scan the stocks for buy and sell signals.
These are script generated signals. Not all scan results are shown here. The MACD signal should use with price action. Users must understand what MACD and price action are all about before using them. If necessary you should attend a course to learn more on Technical Analysis (TA) and Moving Average Convergence Divergence, MACD.
Once again, the website does not guarantee any results or investment return based on the information and instruction you have read here. It should be used as learning aids only and if you decide to trade real money, all trading decision should be your own.
We learn from many past and present great traders. Kudo to these master.