27 July 2021
Welcome!
Welcome to AmiBroker Academy dot com, amibrokeracademy.com.
Trading is all probability. You buy or sell from your observation.
Saw a very famous training company live talking about organizing a cryptocurrency trading training. Just wonder, how much will the course be. If Bitcoin is around 37,000 dollars. A simple training course for trading cryptocurrency could easily price ten thousand dollars. Think think got more things. Is the price action chart of Crypto different from other stock chart. You say lah. Price Action is price action, indicator is indicator.
We are going to post all the cryptocurrencies we capture so far.
Remember trading is all about observation, reading the price bar and not news.
As for price bar, it is what the market supply and remand. When market feel that is over price, the price will drop. All this reflected on the price bar almost instantly.
Next is how to read our price bar plus using some tools, such as MACD.
Here, we simply translate price action chart into layman language. This will help you in understand the financial instrument you are trading. We believe picture worth a thousand words. So, sometimes we use less words. You can learn the price action interpretation too. Give it a tray. You may not have the same view points as us. Remember all analysis read price action chart differently. It is just like reading an essay, we will have different conclusion.
Trade well.
Trade what you see. Manage your risk.
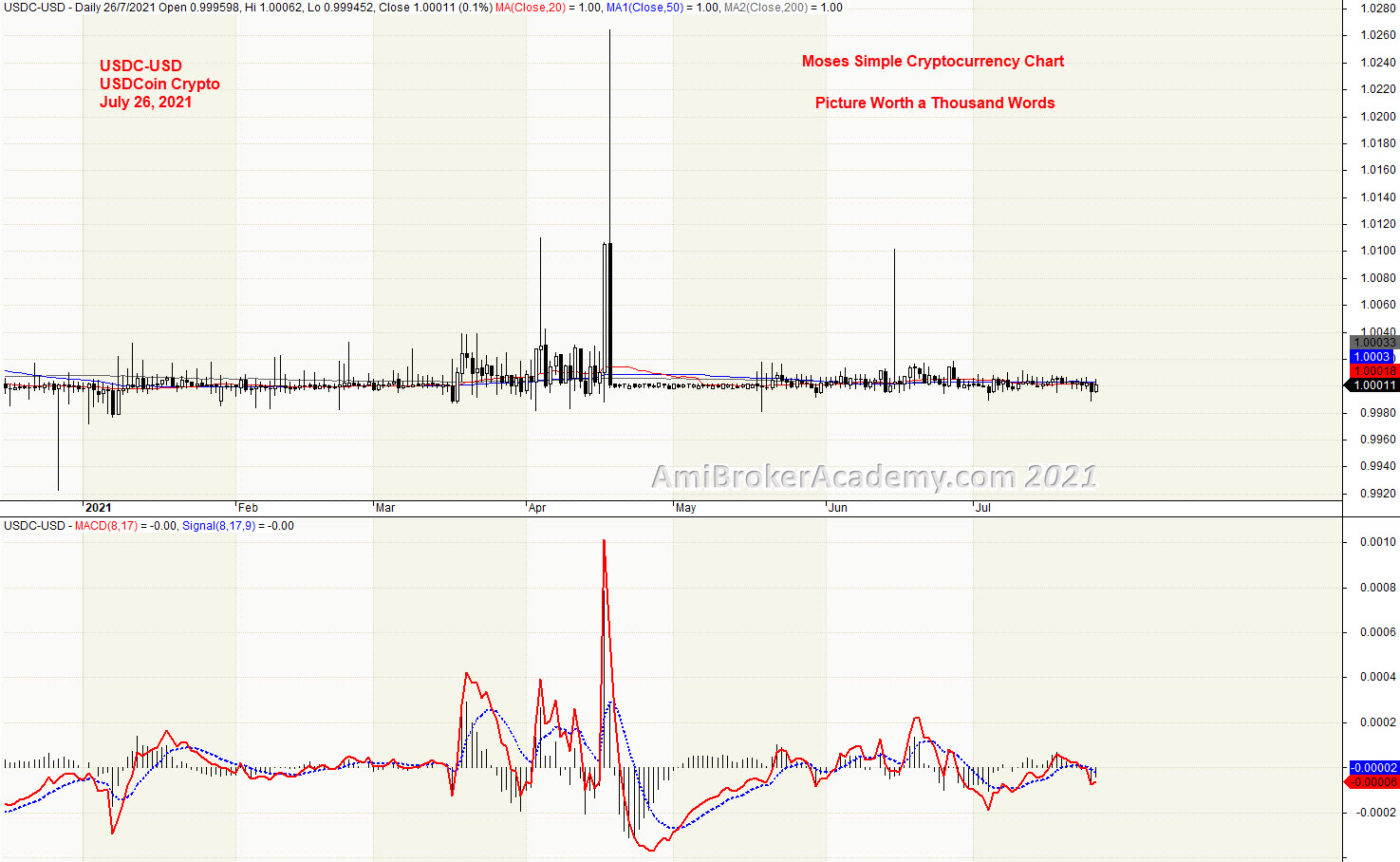
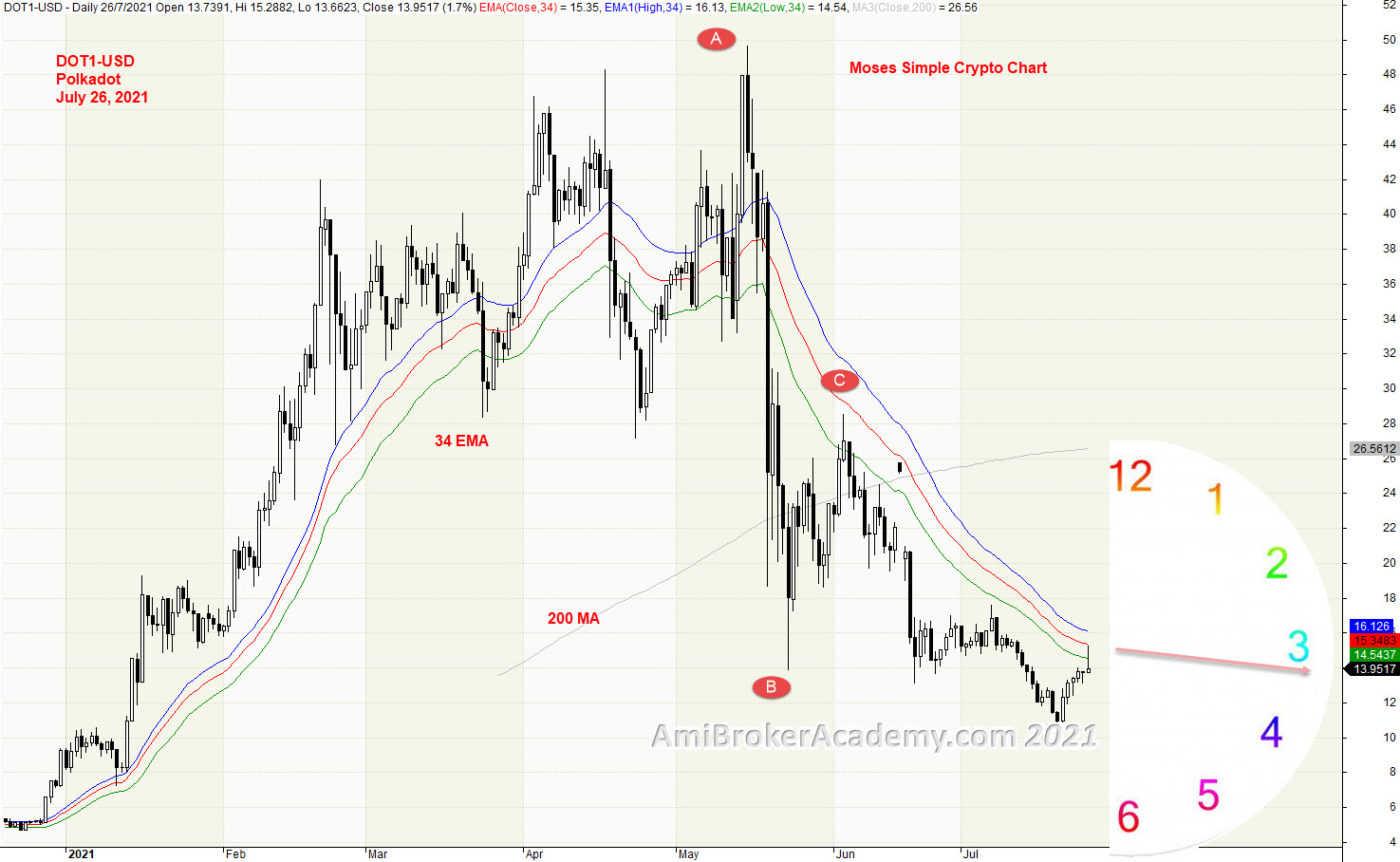
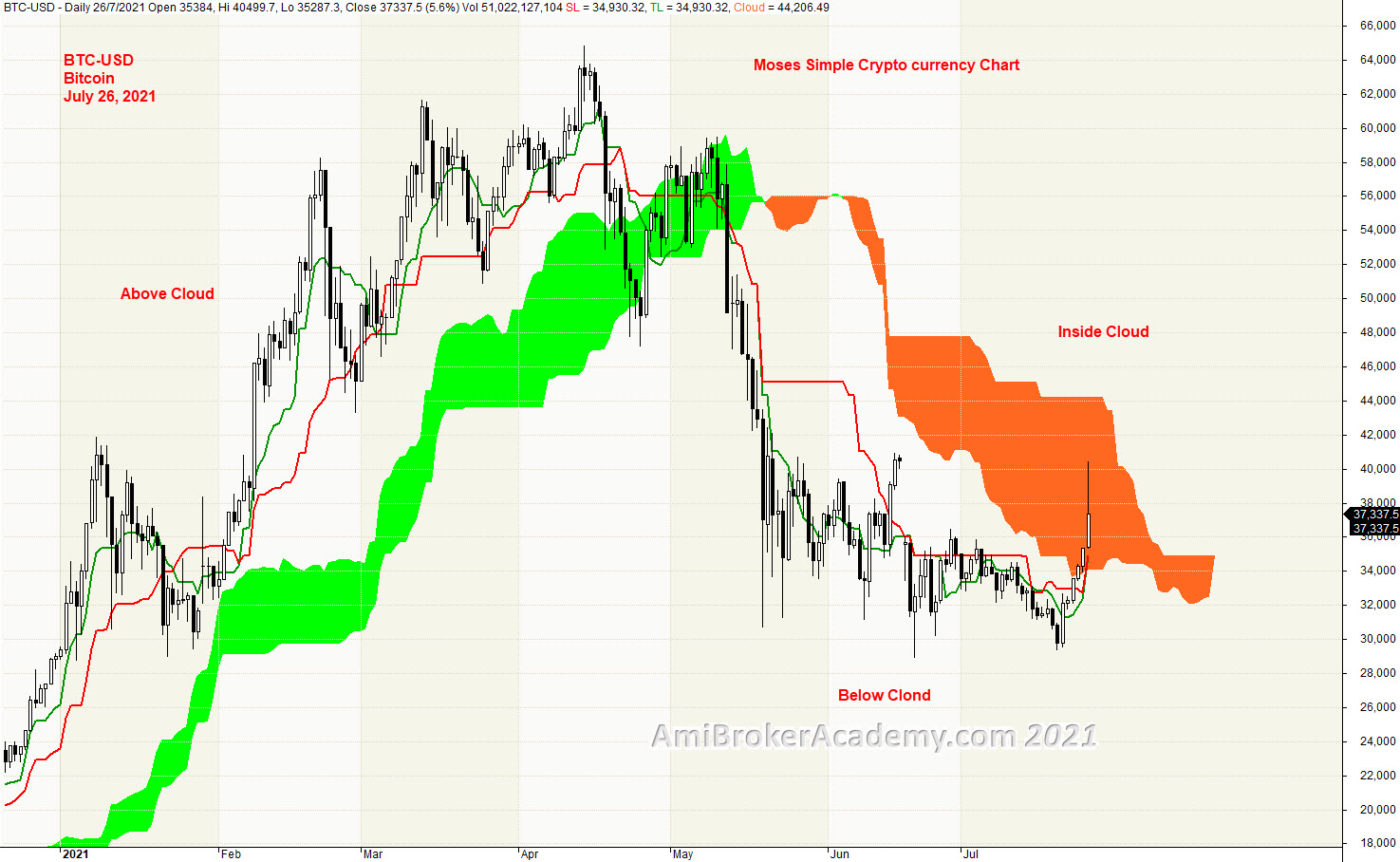
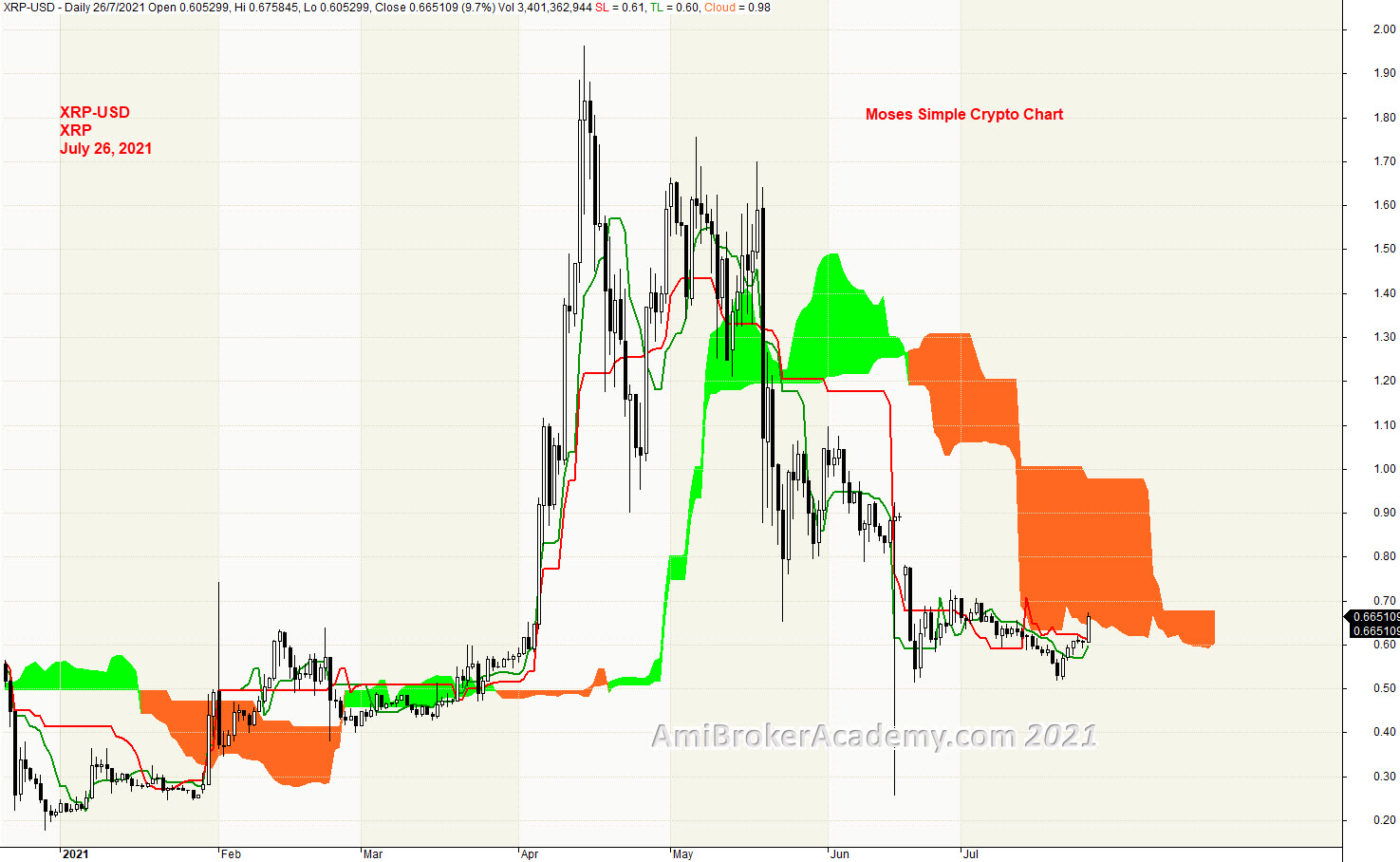
Picture worth a thousand words. We are not going to explain any more. Just see the picture. …
USDCoin USDC
Polkadot DOT1
Bitcoin
XRP
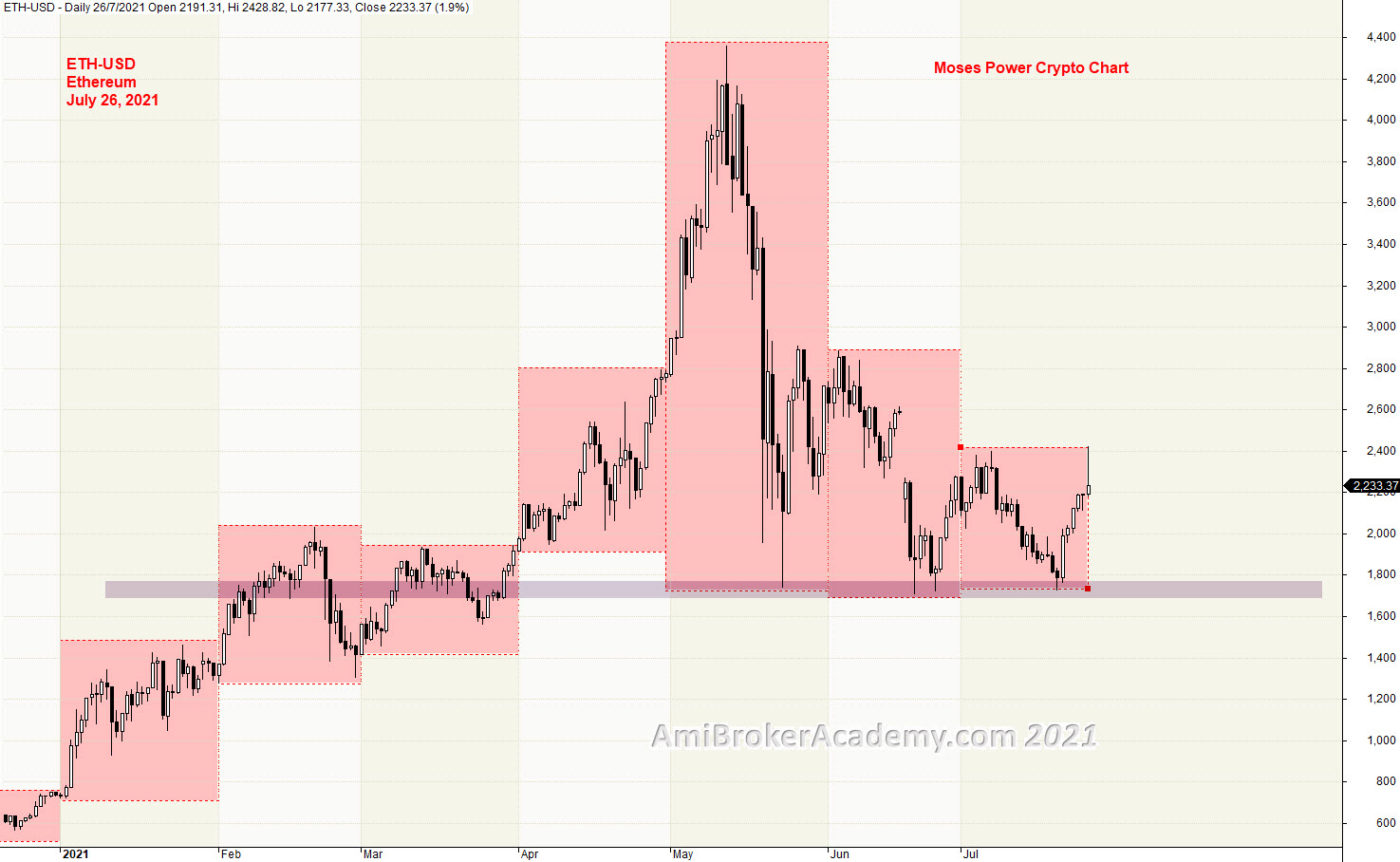
Ethereum
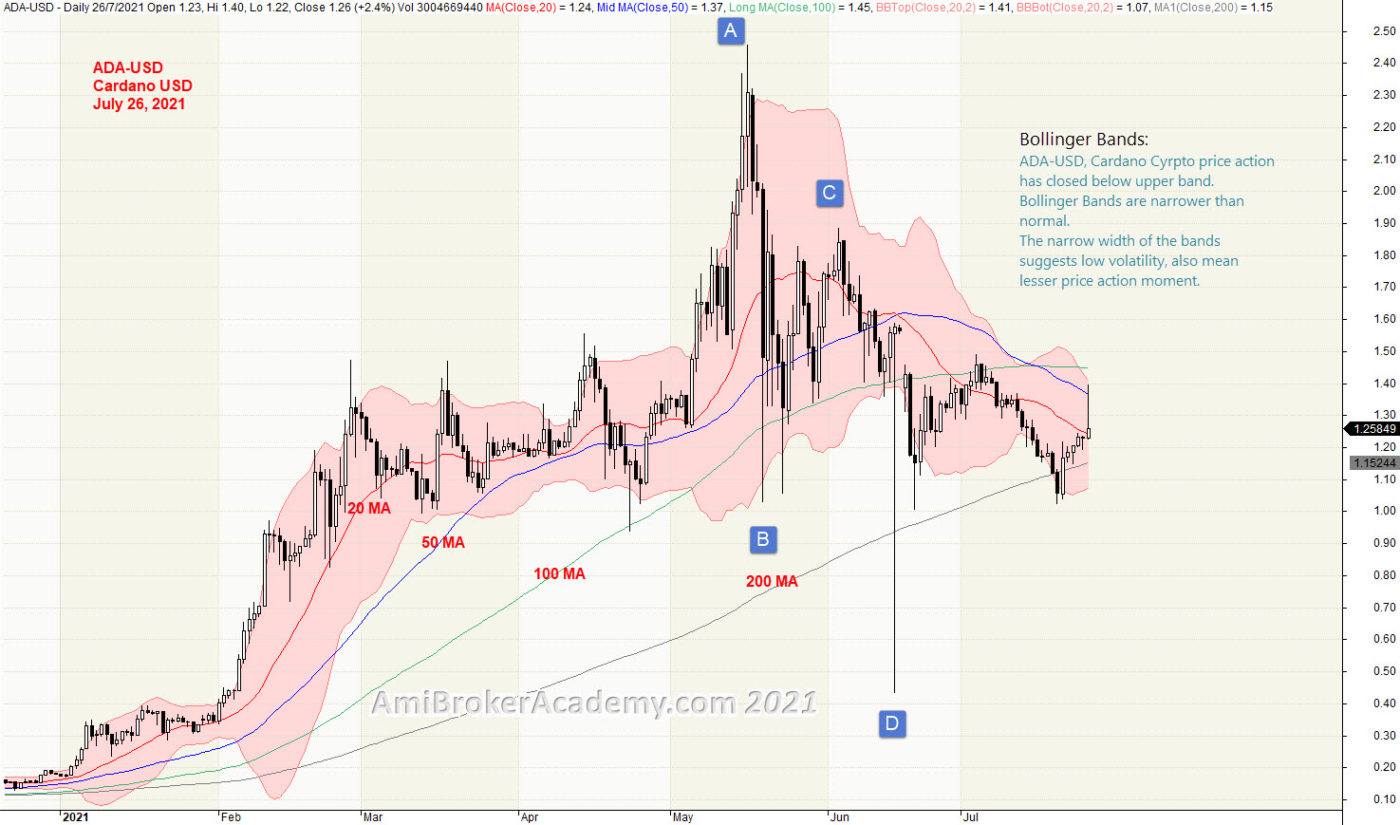
Cardnano
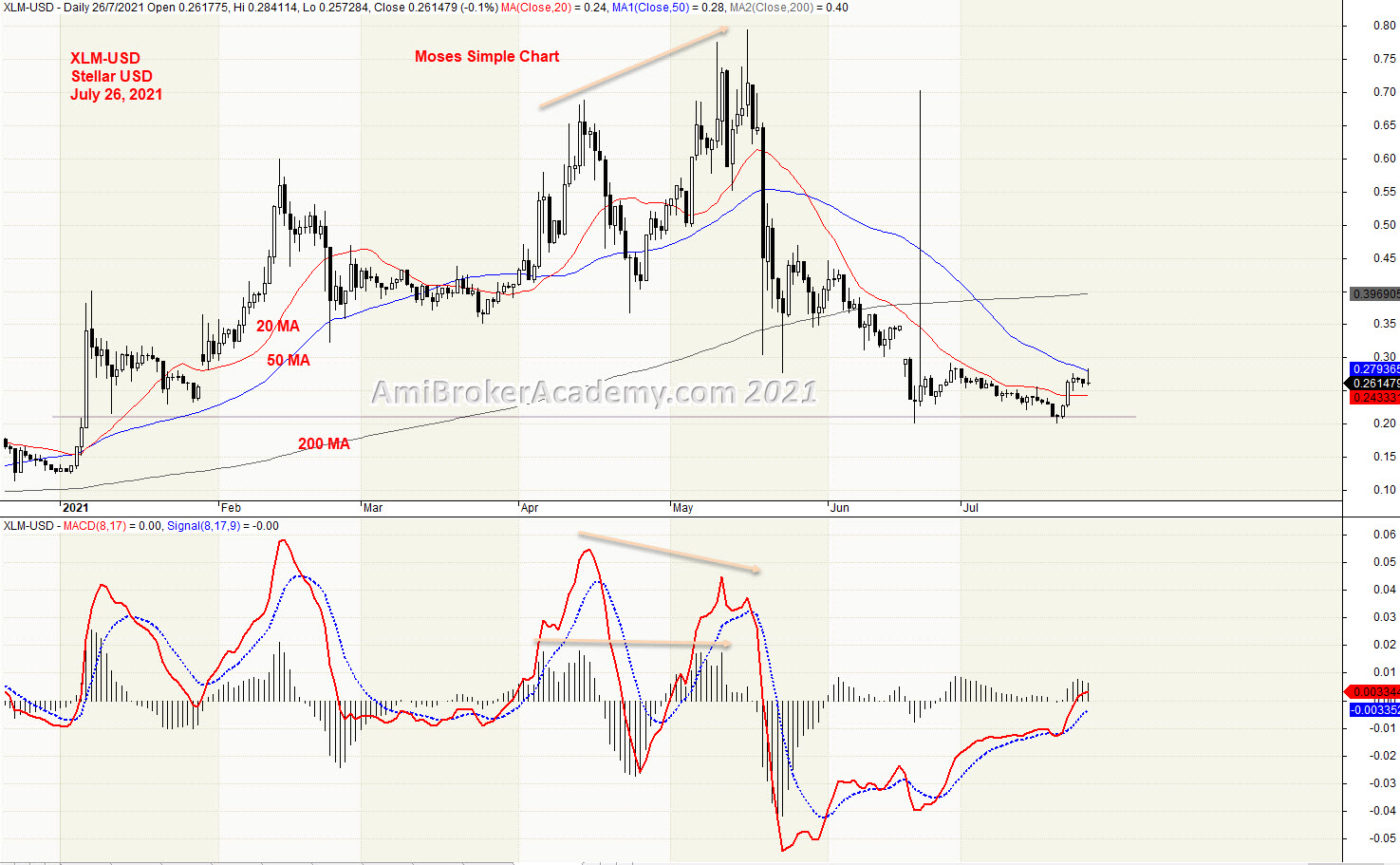
Stellar
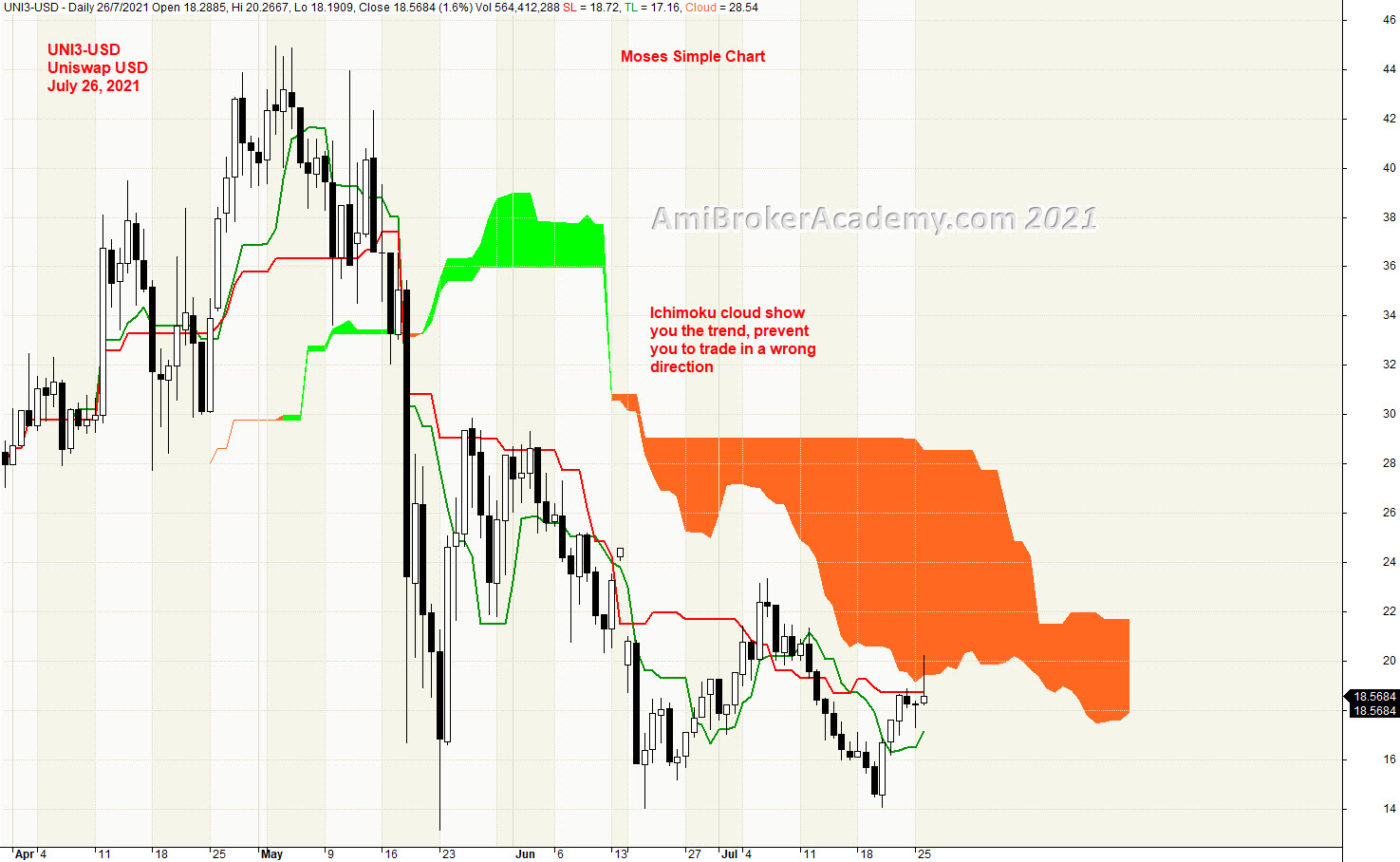
Uniswap
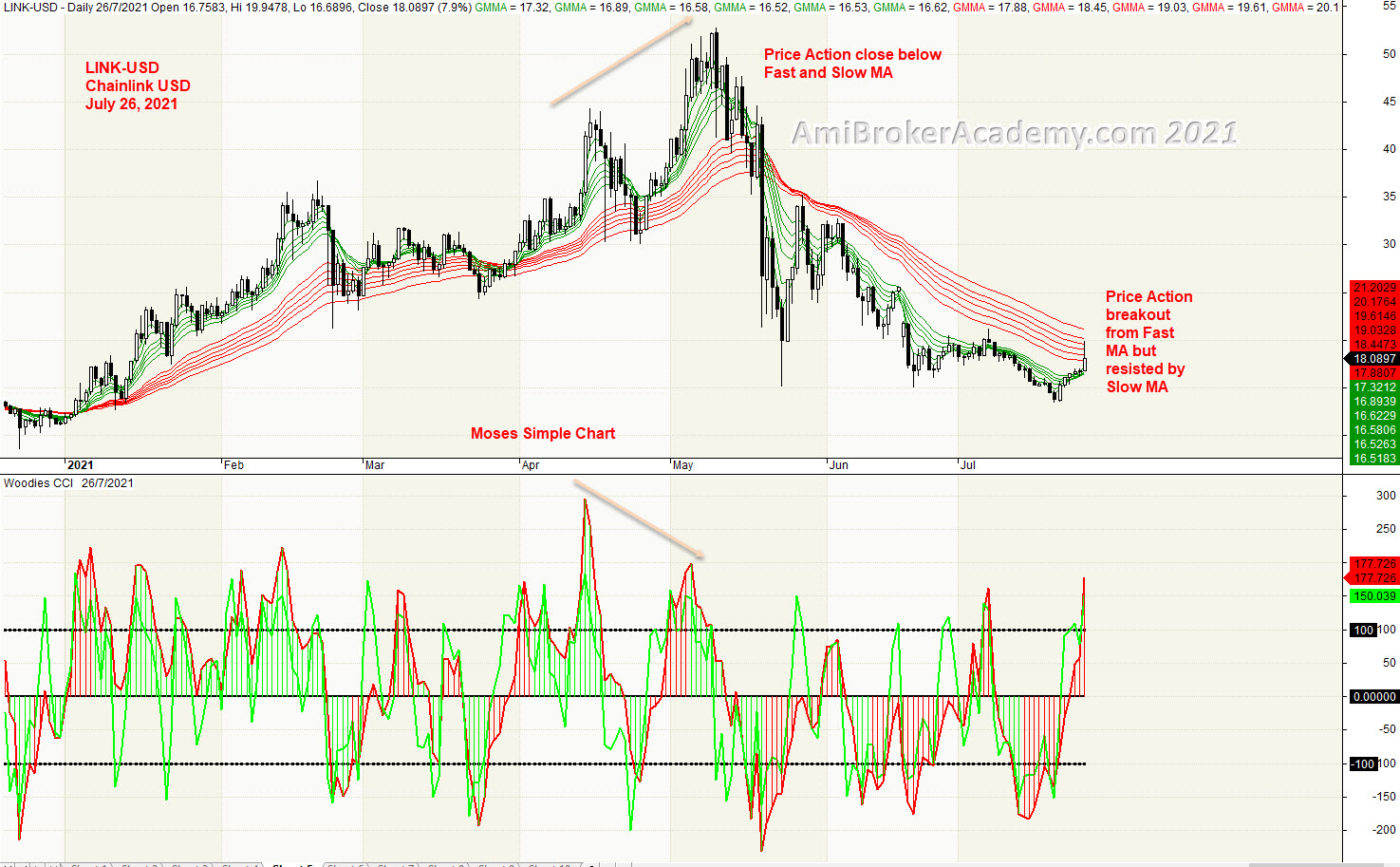
Chainlink
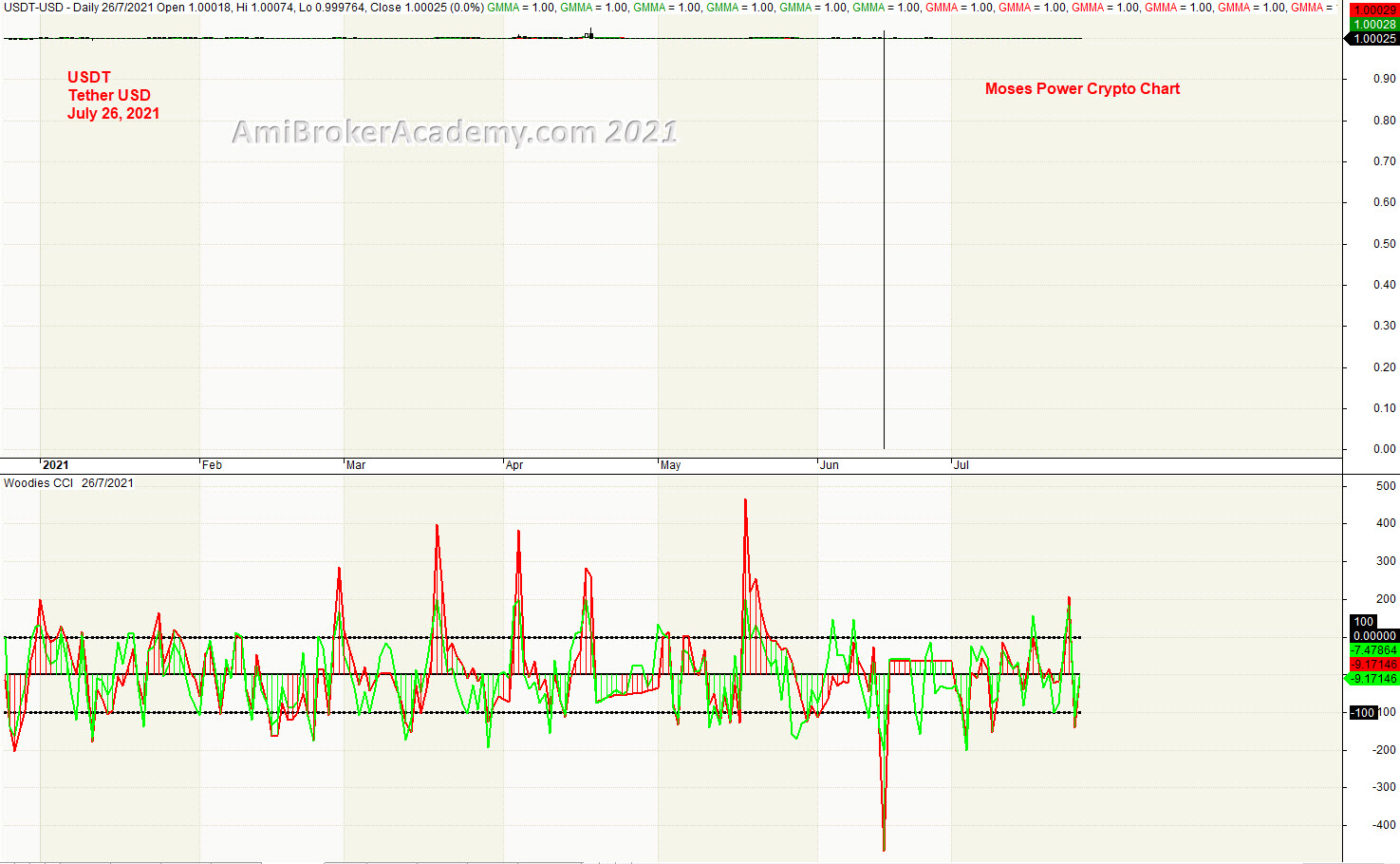
Tether
1) USDCoin Crypto and MACD
2) Polkadot
3) Bitcoin and Ichimoku Cloud
4) XRP and Ichimoku Cloud
5) Ethereum and support resistance
6) Cardano Crypto and Bollinger Bands and Moving Averages
7) Stellar USD
8) Uniswap USD
9) Chainlink Crypto and GMMA and Woodies CCI
10) Tether USD
Moses Power Charting
Official AmiBrokerAcademy.com Charting
Disclaimer
The above result is for illustration purpose. It is not meant to be used for buy or sell decision. We do not recommend any particular stocks. If particular stocks of such are mentioned, they are meant as demonstration of Amibroker as a powerful charting software and MACD. Amibroker can program to scan the stocks for buy and sell signals.
These are script generated signals. Not all scan results are shown here. The MACD signal should use with price action. Users must understand what MACD and price action are all about before using them. If necessary you should attend a course to learn more on Technical Analysis (TA) and Moving Average Convergence Divergence, MACD.
Once again, the website does not guarantee any results or investment return based on the information and instruction you have read here. It should be used as learning aids only and if you decide to trade real money, all trading decision should be your own.
We learn from many past and present great traders. Kudo to these master.