9 August 2021
Welcome!
Welcome to AmiBroker Academy dot com, amibrokeracademy.com.
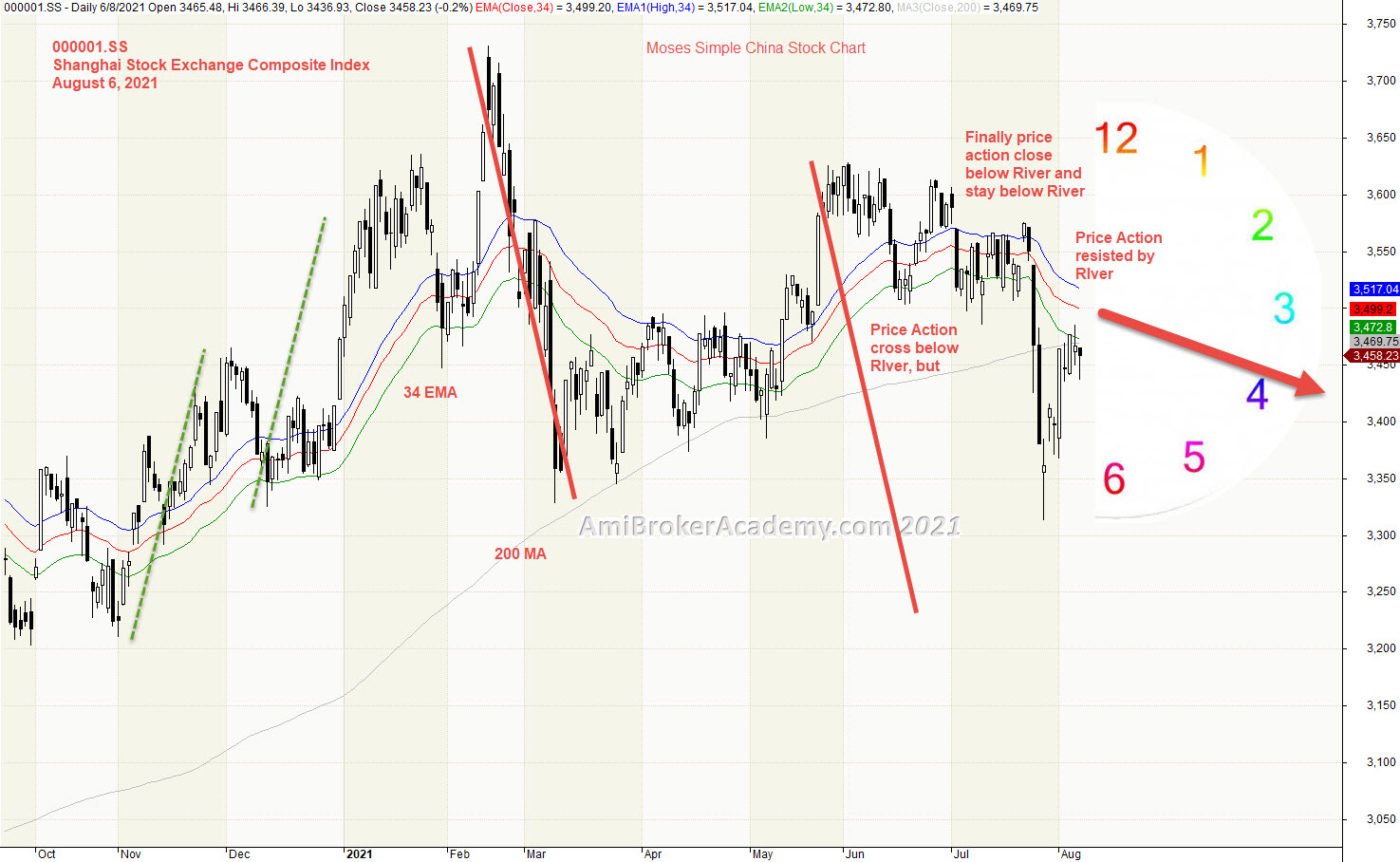
1) 000001.SS | Shanghai Stock Exchange Composite Index
Study China stock market, Shanghai Stock Exchange Composite Index price action. We use moving averages, moving average is a good visual tool. Raghee use 34 EMA, high, low and close moving averages. We call the band as River. From the River we can see price action either above or below river. River can act as support or resistance.
See chart, we find the stock price finally resisted by RIver. River is pointing between three and four o’clock.
Remember, we just read what the chart said. Have fun!
In our previous analysis, from the H M Gartley pattern, we see there is a potential bear ABCD pattern.
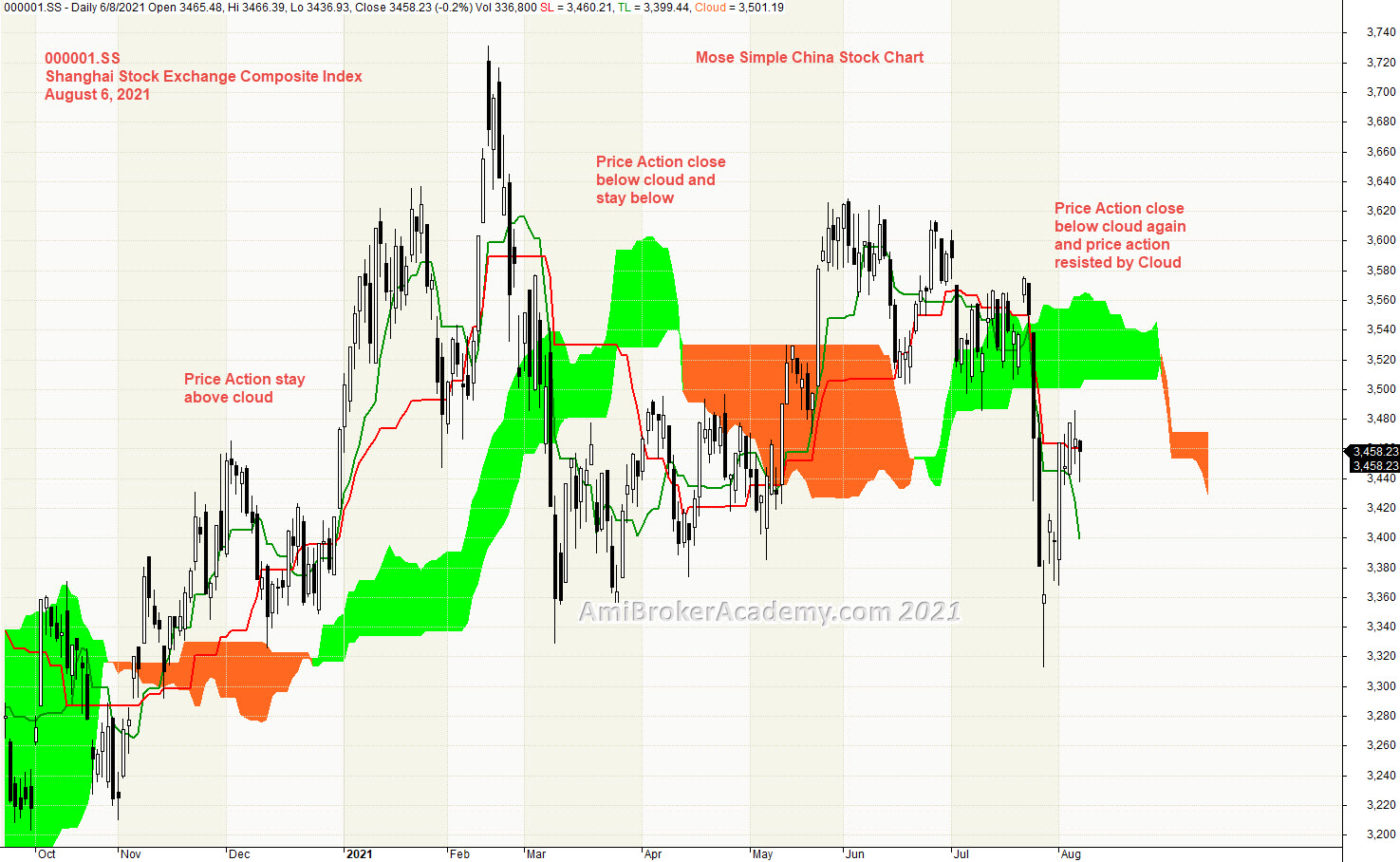
2)Shanghai Stock Exchange Composite Index
Ichimoku Cloud is a great trending tool, price action is either above or below cloud. Following the trend, the tool can prevent you from trading in a wrong direction.
From the chart, price action from above the cloud to finally below the cloud. Now price action is below cloud and become bear trend.
Trade what you see. Mange your risk.
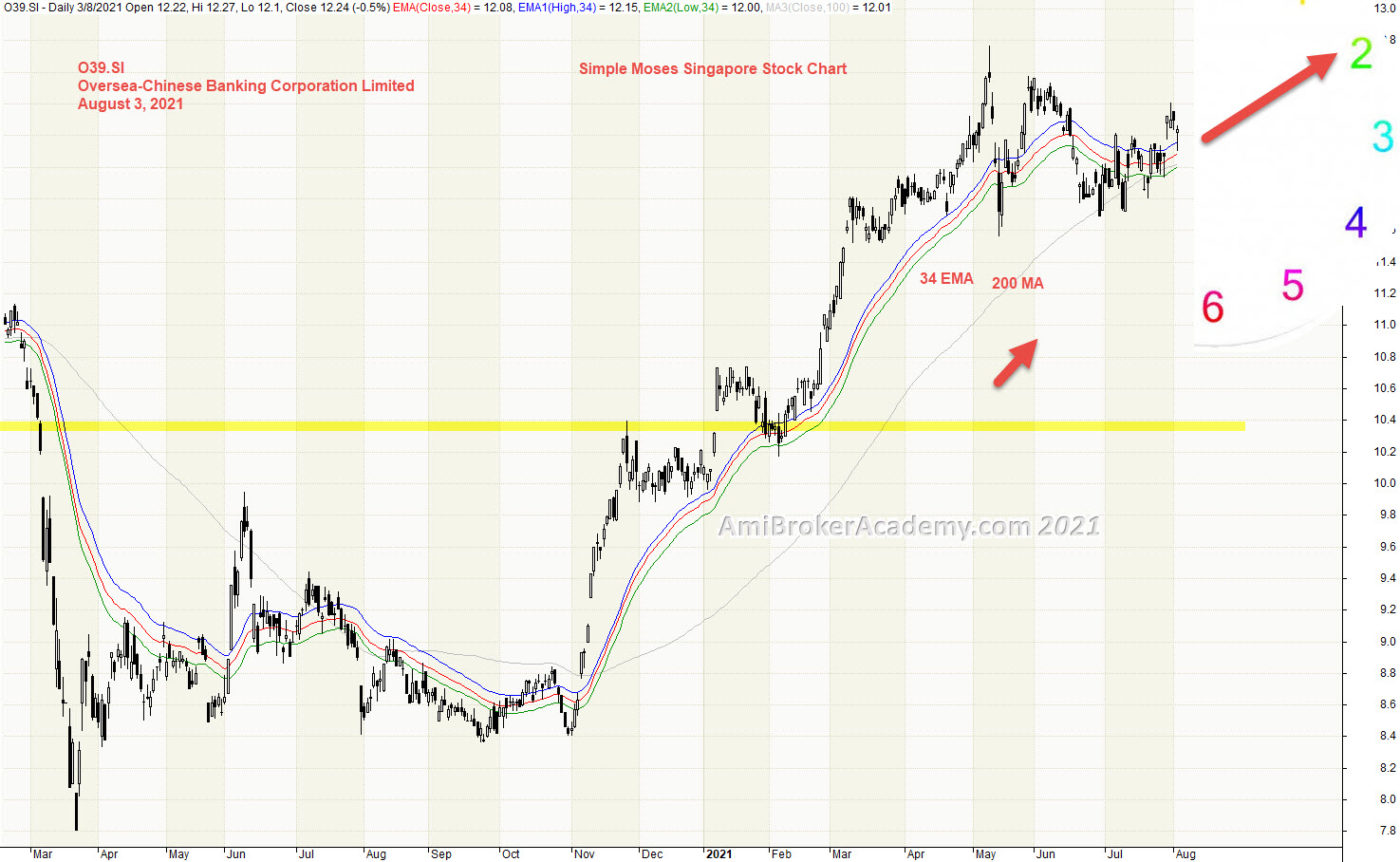
3) OCBC Oversea-Chinese Banking Corporation and River
Price Action is pointing to Two o’clock direction, price action is very bull bias. See chart, we see the trend is slopping up and up.
Moving Average is a great visual tool. Raghee uses high, low and close of 34 EMA to form a band to determine the wave direction. Price action goes from below 34 EMA to above River. Occasionally, price action deep below the RIver, very quickly go above again. Price Action may go higher
River is a great support resistance tool too. Catch the support to find the entry. Remember to reduce risk by buy support and take profit to sell resistance.
Manage your risk.
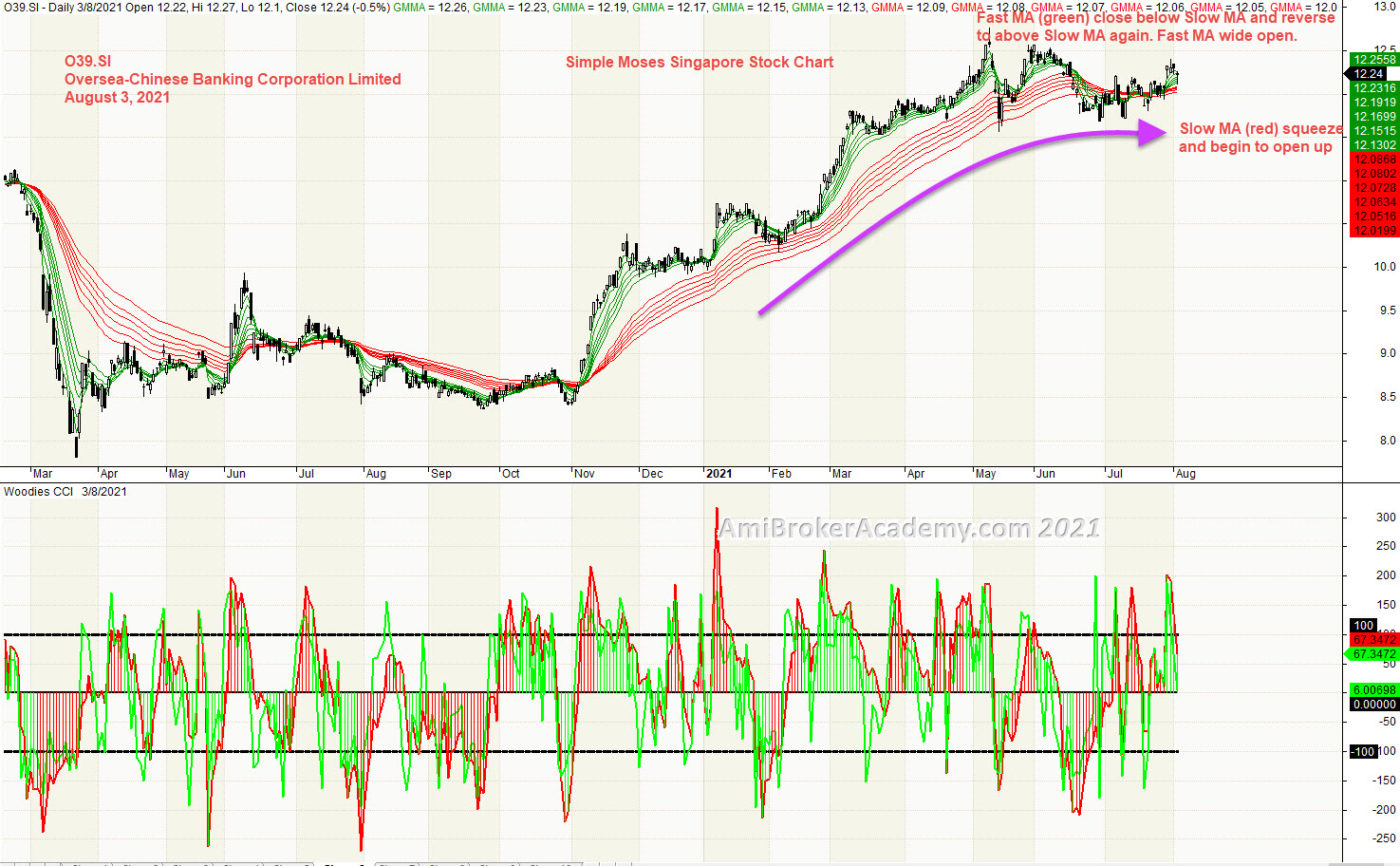
4) OCBC Oversea-Chinese Banking Corporation and GMMA and Woodies CCI
We ask you to stand aside when you are not sure. Study OCBC stock price action with GMMA and Woodies.
Bull trend, why? Price action and Fast MA (green) from bottom to above Slow MA (red) and stay above.
From Woodies CCI, price action continues to go higher. But, Woodies CCi is forming lower high. Divergence. Price Action might be topping. Trade with eyes open.
Mange your risk.
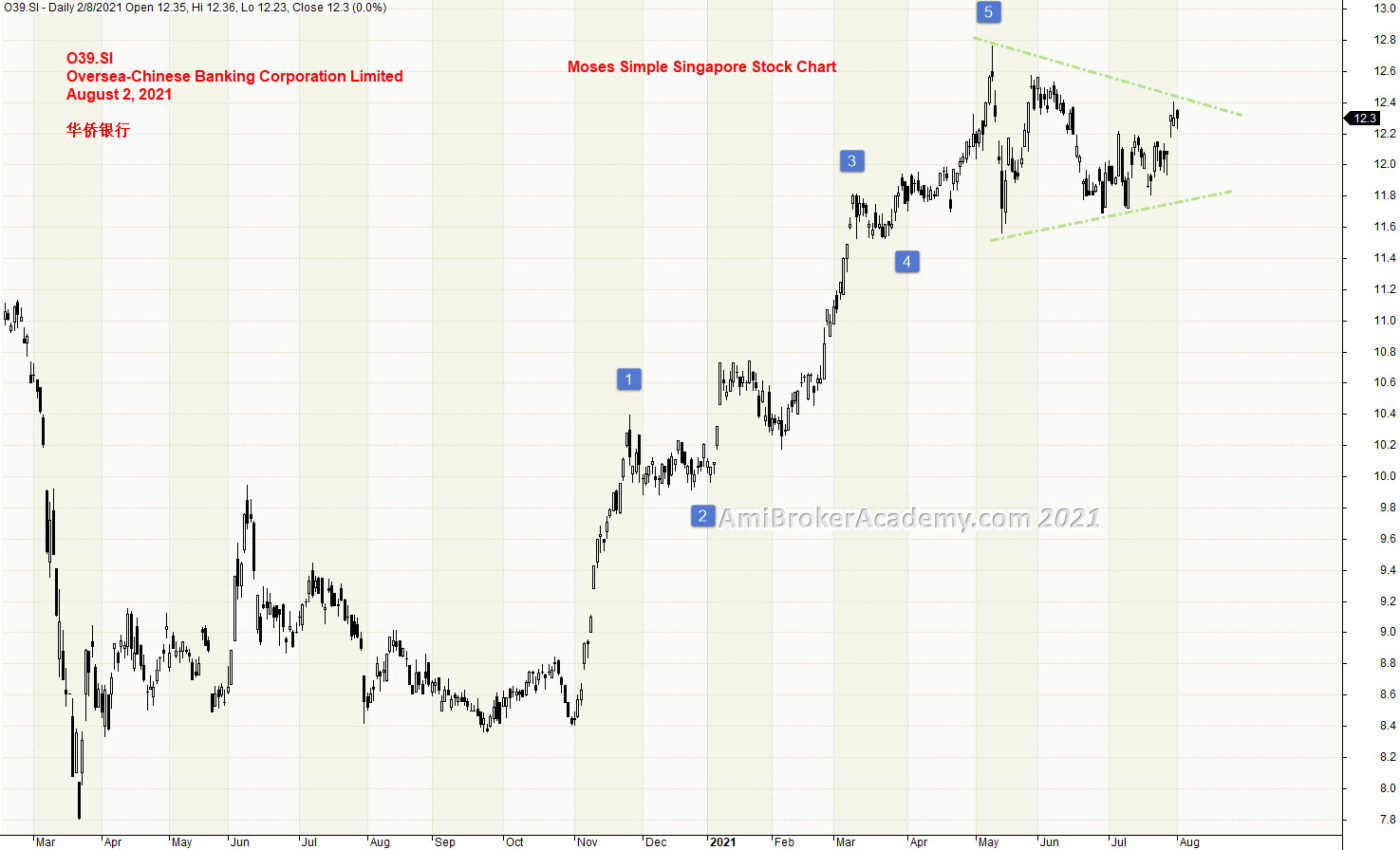
5) Oversea-Chinese Banking Corporation Elliott Wave
Price Action and waves, from Elliott Wave count, seem like price action has completed the five waves.
Mange your risk.
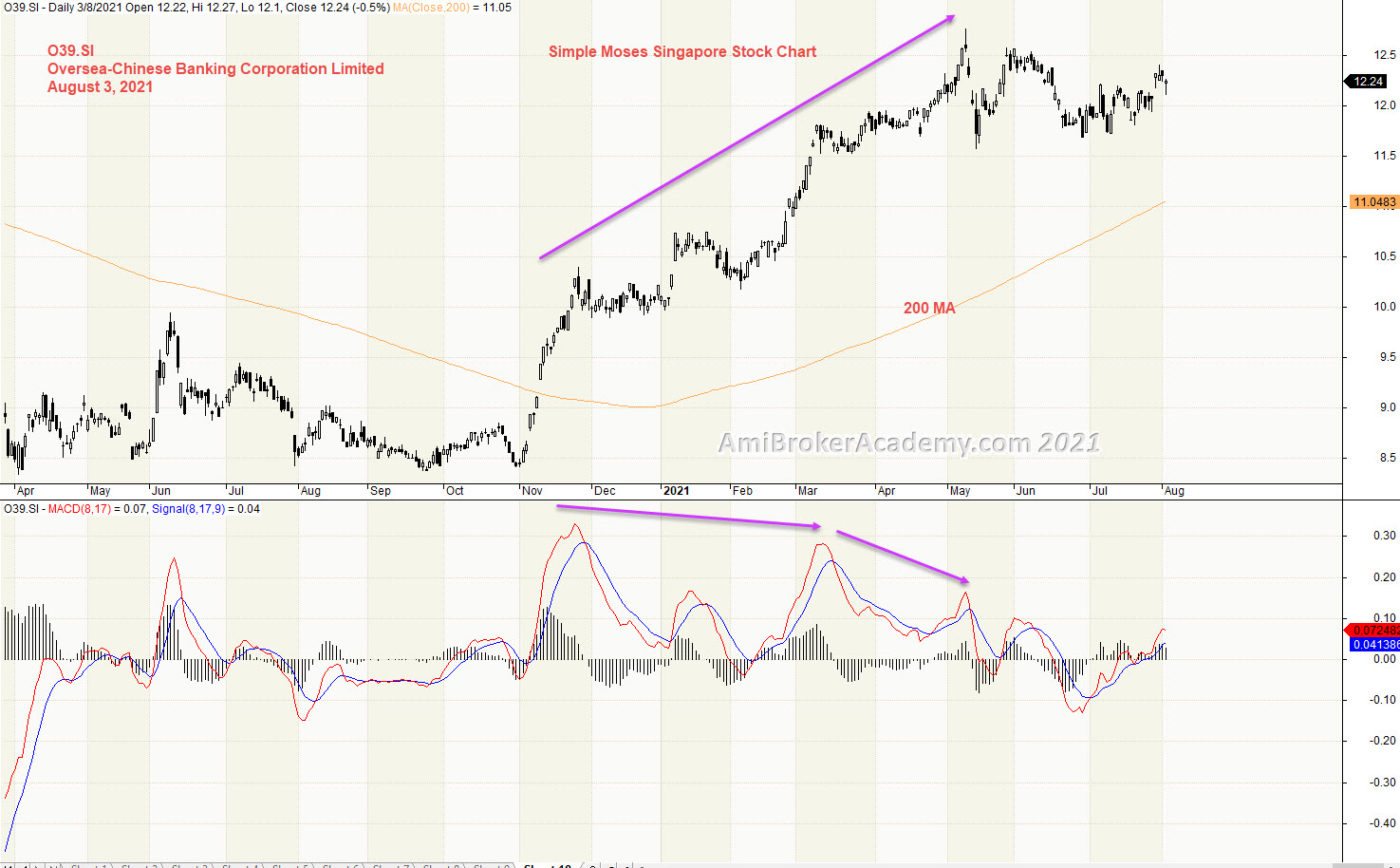
6) OCBC Oversea-Chinese Banking Corporation and MACD
We study price action we see MACD Divergence, price action continues to go higher, but MACD begin to form lower high and MACD Histogram to form lower high. So we expect a reversal is going to happen. But by now everyone has learnt that MACD Divergence is like a traffic light, you don’t stop at every traffic light. So, be the MACD Divergence. The price action may not pullback. But topping signal has now showed.
Trade what you see. We are looking for bear signal, and confirmation. MACD cross signal is a good indication to lookout for.
So, read the information you can get from the chart.
Remember, we just read what the chart said. Have fun!
But. don’t play play with MACD indicator. Very simple yet powerful.
Moses Power Charting
Official AmiBrokerAcademy.com Charting
Disclaimer
The above result is for illustration purpose. It is not meant to be used for buy or sell decision. We do not recommend any particular stocks. If particular stocks of such are mentioned, they are meant as demonstration of Amibroker as a powerful charting software and MACD. Amibroker can program to scan the stocks for buy and sell signals.
These are script generated signals. Not all scan results are shown here. The MACD signal should use with price action. Users must understand what MACD and price action are all about before using them. If necessary you should attend a course to learn more on Technical Analysis (TA) and Moving Average Convergence Divergence, MACD.
Once again, the website does not guarantee any results or investment return based on the information and instruction you have read here. It should be used as learning aids only and if you decide to trade real money, all trading decision should be your own.
We learn from many past and present great traders. Kudo to these master.