5 August 2021
Welcome!
Welcome to AmiBroker Academy dot com, amibrokeracademy.com.
We have been provide our stock chart and analysis for two decades. If you search for amibroker academy, you probably for get all the details about us.
We notice the landscape for trading search has change. We decide to start a deferent prospective for now on. We will try to do it from a inner thinking process. Will try.
1) How You Start?
There are many way to pick a stock for analysis. One is from friend recommendation. Another is from a stock scan script to identify a ‘good’ stock to analyse. Good stock is the script you run, has identified the stock potentially going to move soon or in a near future.
When you have a identified a stock. Use a reasonable stock charting software to study the stock.
2) Charting Software
Let use Straits Times Index as an example.
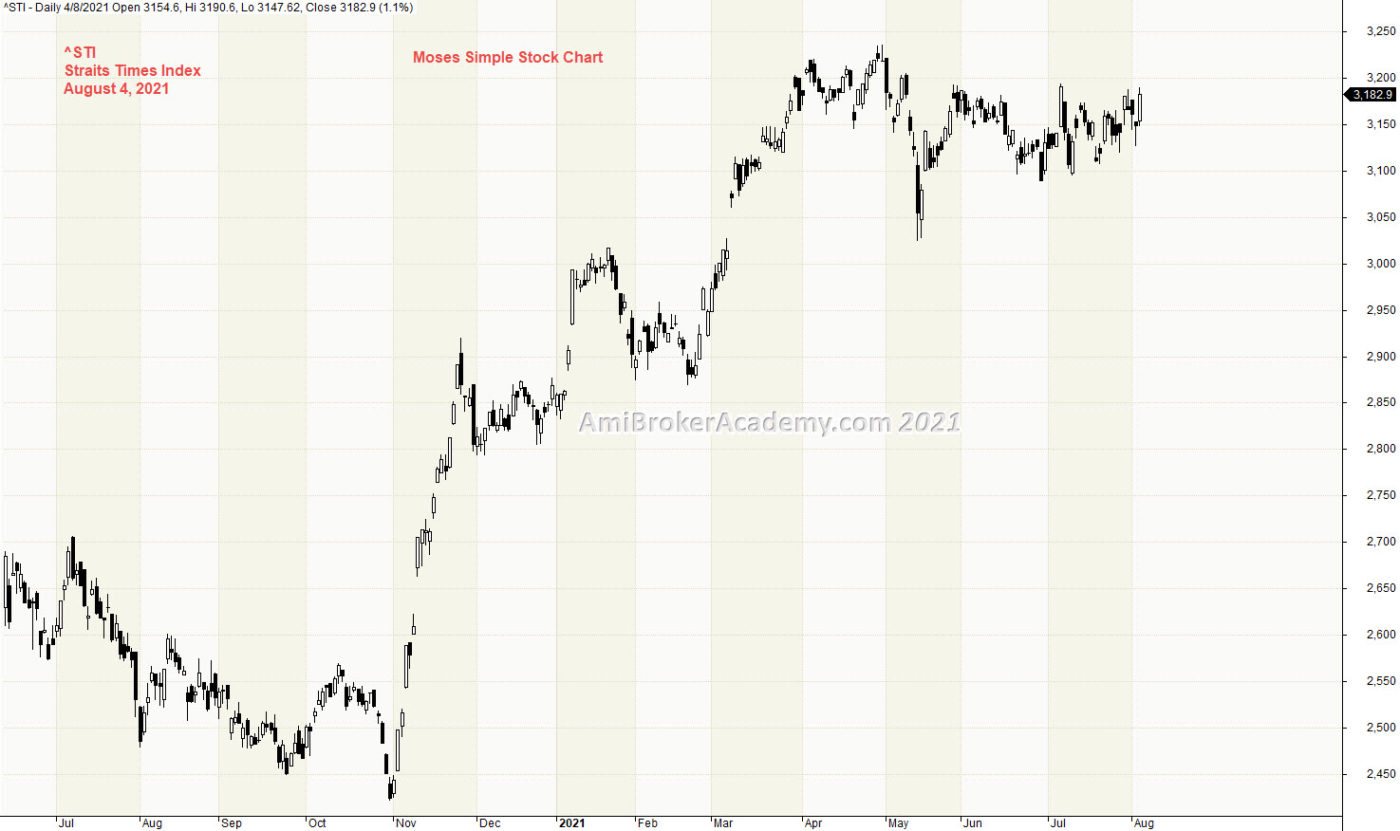
Most of the charting software provide different timeframe, such as 5 minutes, one hour, four hours, day, week, month, or year timeframe. Amibroker charting software is a great tool. You could even download a evaluation copy to check their features out.
Let’s use the daily chart. one key reason, we use the free stock data from Yahoo Finance, so we use EOD, End of Day chart.
Three hundred bars is a good number of candlesticks to study a stock chart. One month has around twenty bars, ten months are about two hundred bars. We use an average of ten, twelve or fourteen months in one chart.
3) What Are You looking for on a Chart? Buy or Sell
When you look at a chart, what are you looking for? First you are looking for buy or sell opportunity. And what will cause you to buy or sell. You buy if the stock is in bull trend. You sell if the stock price is in bear trend.
So, if price action move from low to high, bull trend. When price action moves from high to low, bear trend. When buy look for bull signals to buy. When sell look for bear signals to sell. So, one approach is buy low sell high, in other words buy support sell resistance.
4) What Chart to Look At?
In fact, for price action. There is only three things will happen on a stock chart, one, price action goes higher, two, price action pullback lower, three, price action not move at all.
So, one approach, is only study a bull trend chart to find bull signal to enter the buy entry.
5) So, the sequence on stock analysis
- Identify a stock
- Limit chart to 240 candlesticks
- Find the stock trend
- Skill those bear trend stock chart
- Find bull signal for entry, if not sure stand aside
- When spot the bull trend, look for confirmation before enter the trade
The above is the inner process of a trader.
Moses Power Charting
Official AmiBrokerAcademy.com Charting
Disclaimer
The above result is for illustration purpose. It is not meant to be used for buy or sell decision. We do not recommend any particular stocks. If particular stocks of such are mentioned, they are meant as demonstration of Amibroker as a powerful charting software and MACD. Amibroker can program to scan the stocks for buy and sell signals.
These are script generated signals. Not all scan results are shown here. The MACD signal should use with price action. Users must understand what MACD and price action are all about before using them. If necessary you should attend a course to learn more on Technical Analysis (TA) and Moving Average Convergence Divergence, MACD.
Once again, the website does not guarantee any results or investment return based on the information and instruction you have read here. It should be used as learning aids only and if you decide to trade real money, all trading decision should be your own.
We learn from many past and present great traders. Kudo to these master.