17 July 2021
Welcome!
Welcome to AmiBroker Academy dot com, amibrokeracademy.com.
We will use 1) Ichimoku Cloud, 2) Support Resistance (using box), 3) River (moving average), 4) GMMA and Woodies CCI, 5) Bollinger Bands and Moving Averages, and 6) MACD to analyze price action. We also analyze crypto currency price action. See our posting for Bitcoin and other popular cryptocurries.
What we do is to translate price action chart into layman language for you to understand, ie Picture worth a thousand words. You can learn this too. All analysis read the price action chart differently. It is just like an essay, all reader will have different conclusion.
Trade well.
1) BTC-USD | Bitcoin Crypto and Ichimoku Cloud
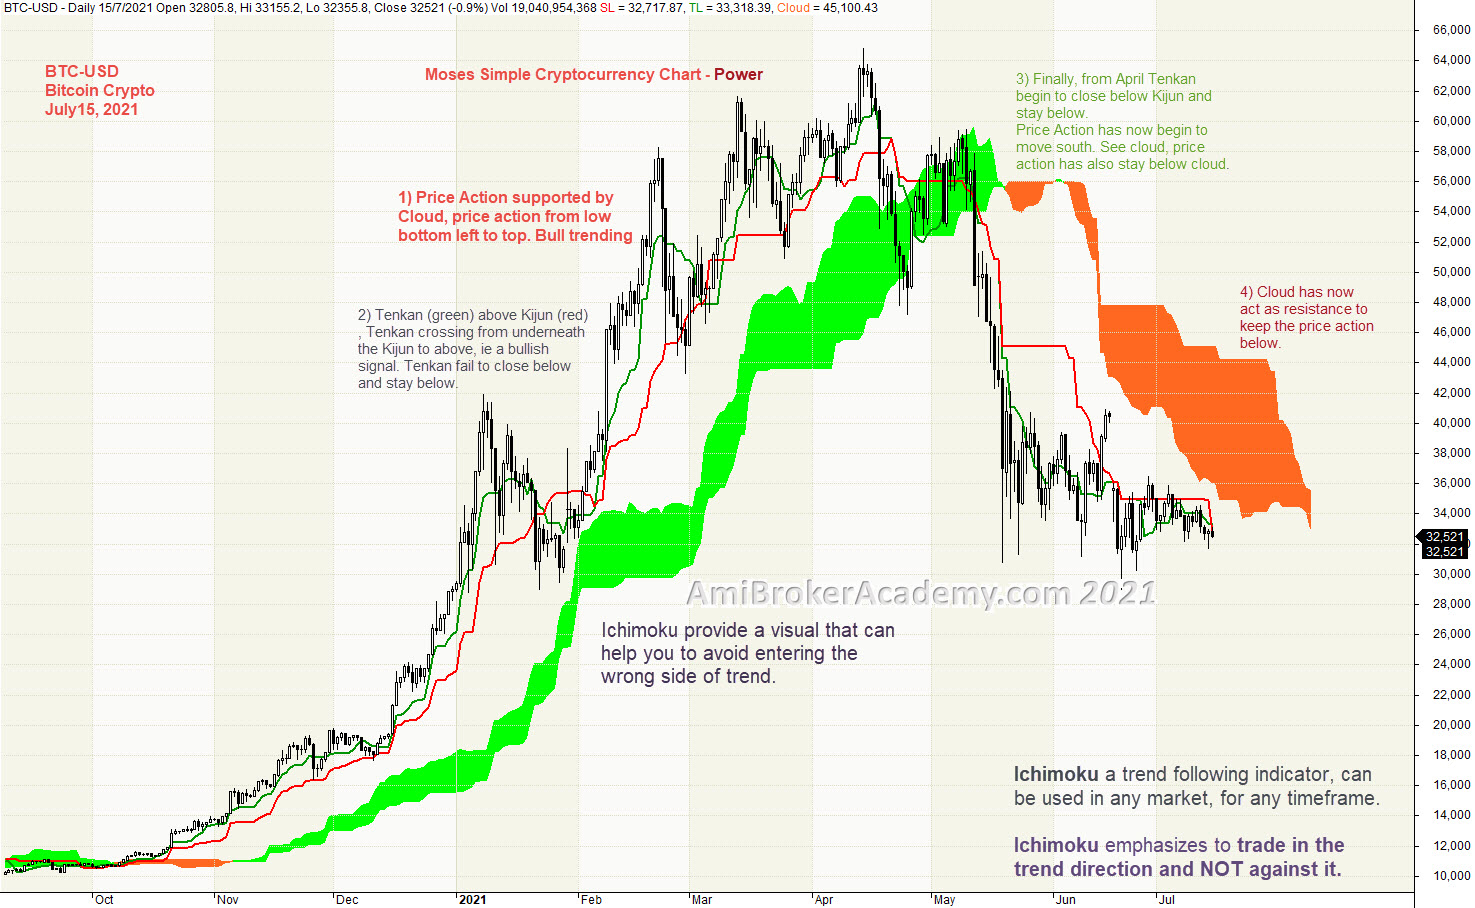
Ichimoku Cloud is a trend following strategy tool, can use in any market and any timeframe. Ichimoku indicator emphasize to trade in the trend direction. We see price action supported byt the cloud. Price Action goes from the bottom left to top, ie Bull trend. We see Tenkan Sen (green) above Kijun Sen (red). Tenkan cross below Kijun and fail, bull trend. Finally, from April, Tenkan begin to close below Kijun and stay below. Price Action has begin to move south. Price Action begin to stay below cloud. Cloud act as resistance to keep the price action lower.
Ichimoku is a great visual tool, to help to avoid trading in the wrong direction.
Ichimoku Cloud is a multi-dimensional indicator designed to offer support and resistance levels, trending, and entry and exit points. Besides that, Ichimoku is an indicator that gauges future price momentum and determine futures areas of support and resistance. Price Action is currently below cloud.
Trade what you see. See a potential support.
Manage risk is a key in trading.
Moses Free Charting
2) Bitcoin Crypto and Support Resistance
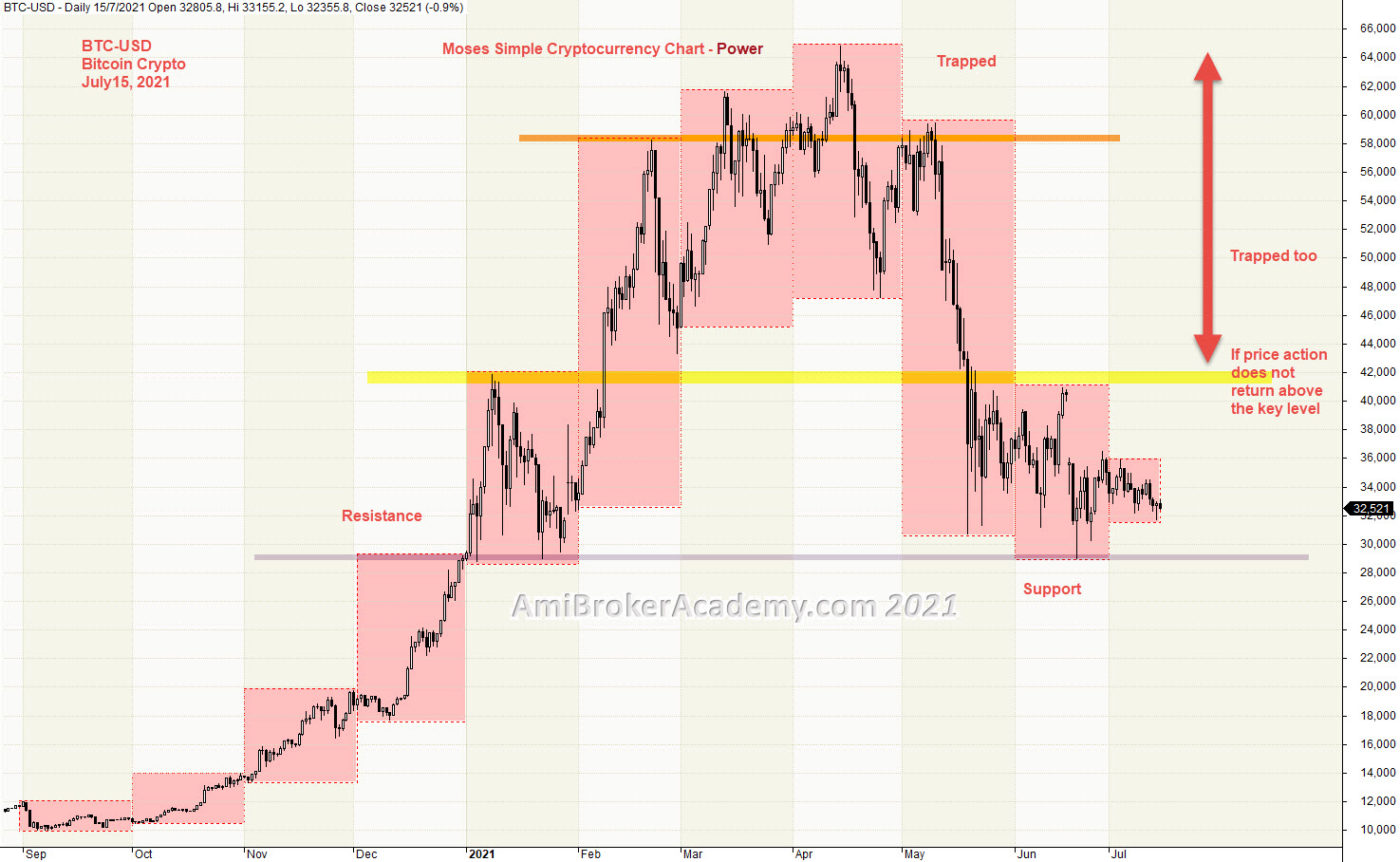
Price Action goes from low to high. You can see price action goes from bottom in last September to top in April. Price Action thereafter pullback and form lower high and lower high again.
We use box to box month high low to find a key level. See chart. We have plotted three strong levels. We also find that February and May is the most volatile month, see the box size.
Trade what you see. Manage your risk.
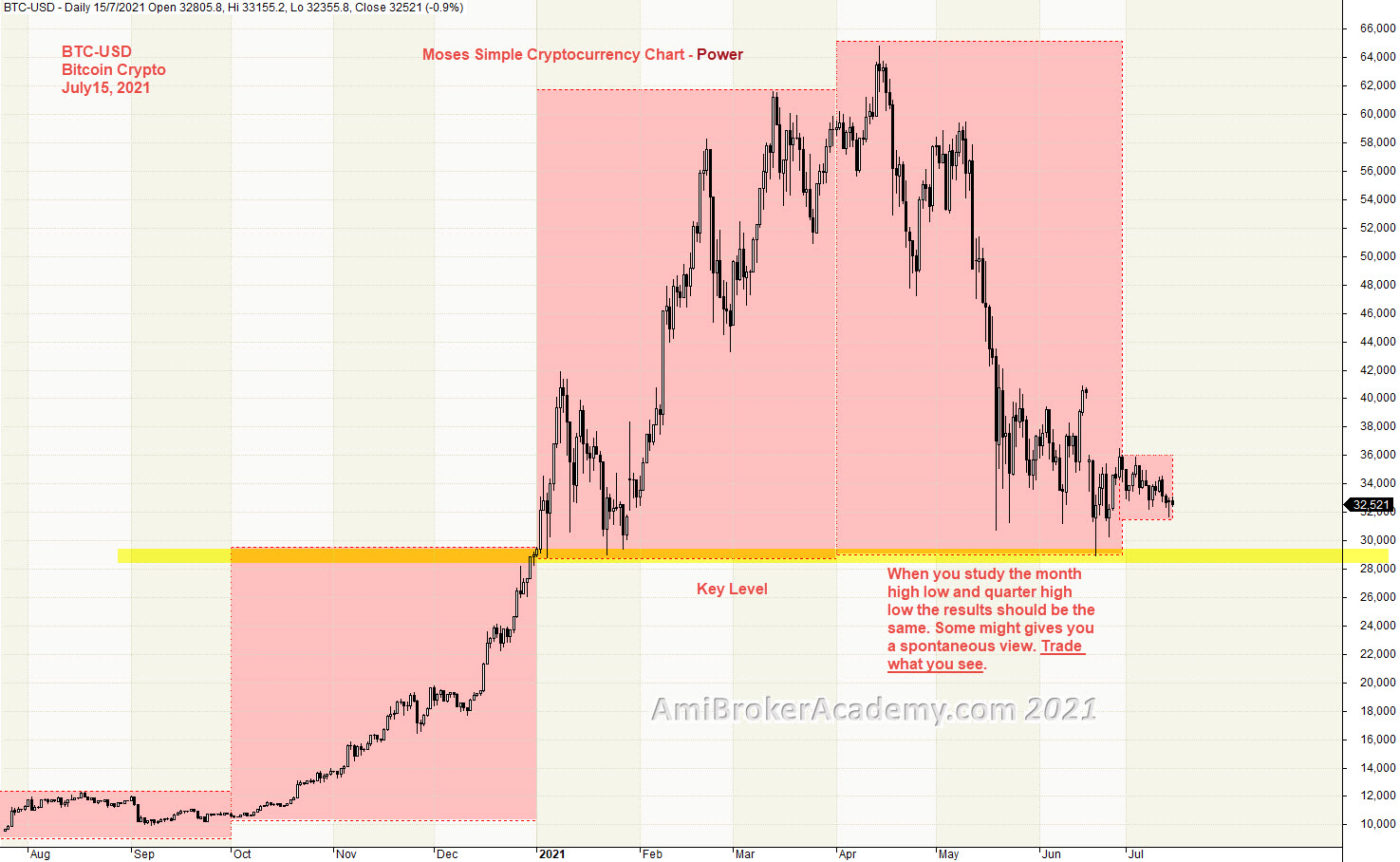
Bitcoin Crypto Quarter Box and Support Resistance
We sometime box such as quarter instead of months, from the quarter high low to find key level too. See chart.
3) Bitcoin Crypto and River
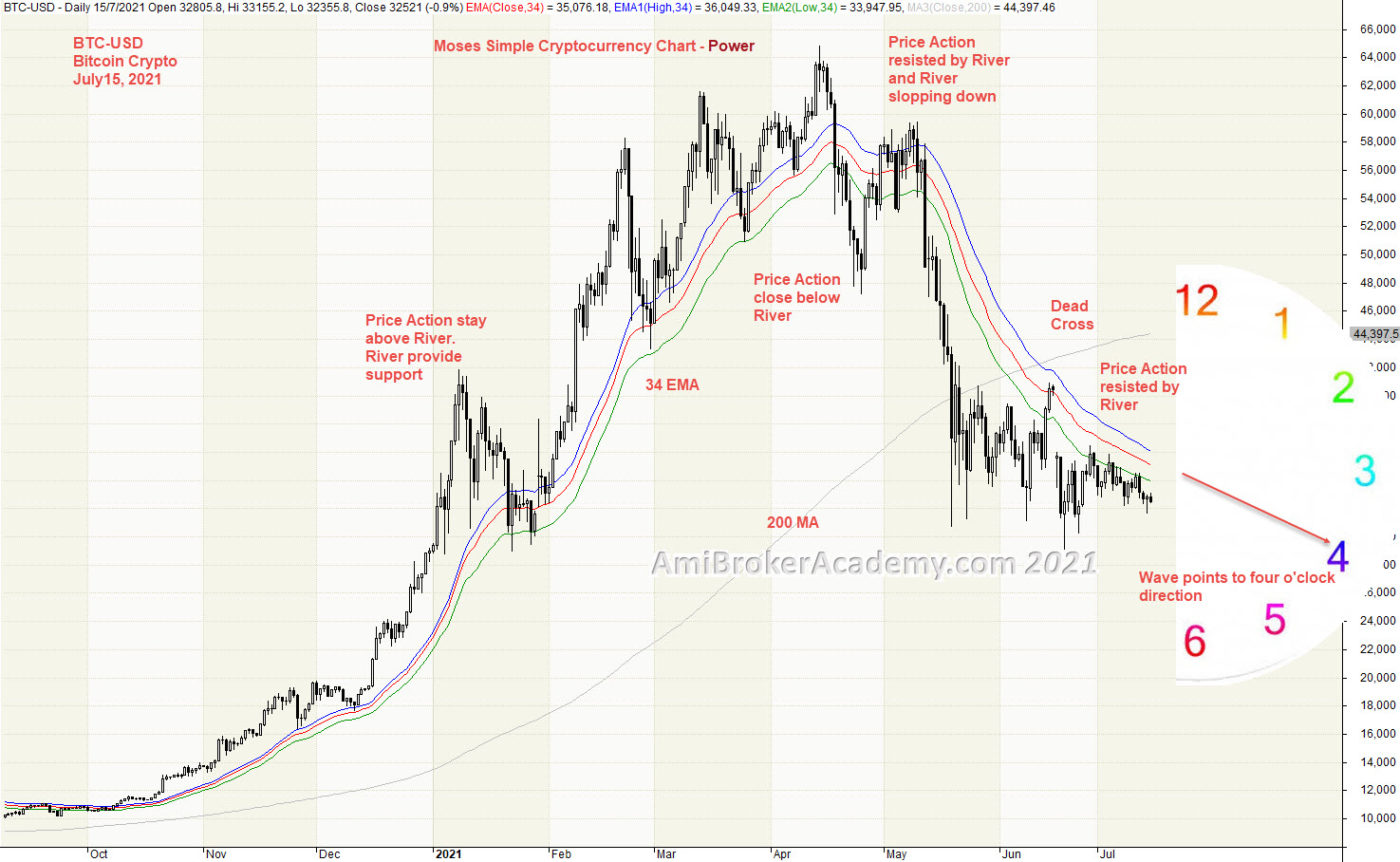
Moving Average is a great visual tool. Raghee uses high, low and close 34 EMA to form a band to determine the wave direction. Price action goes from above 34 EMA to below River. Price Action fail to go higher and begin to go south. Price Action now stay below River.
Manage your risk.
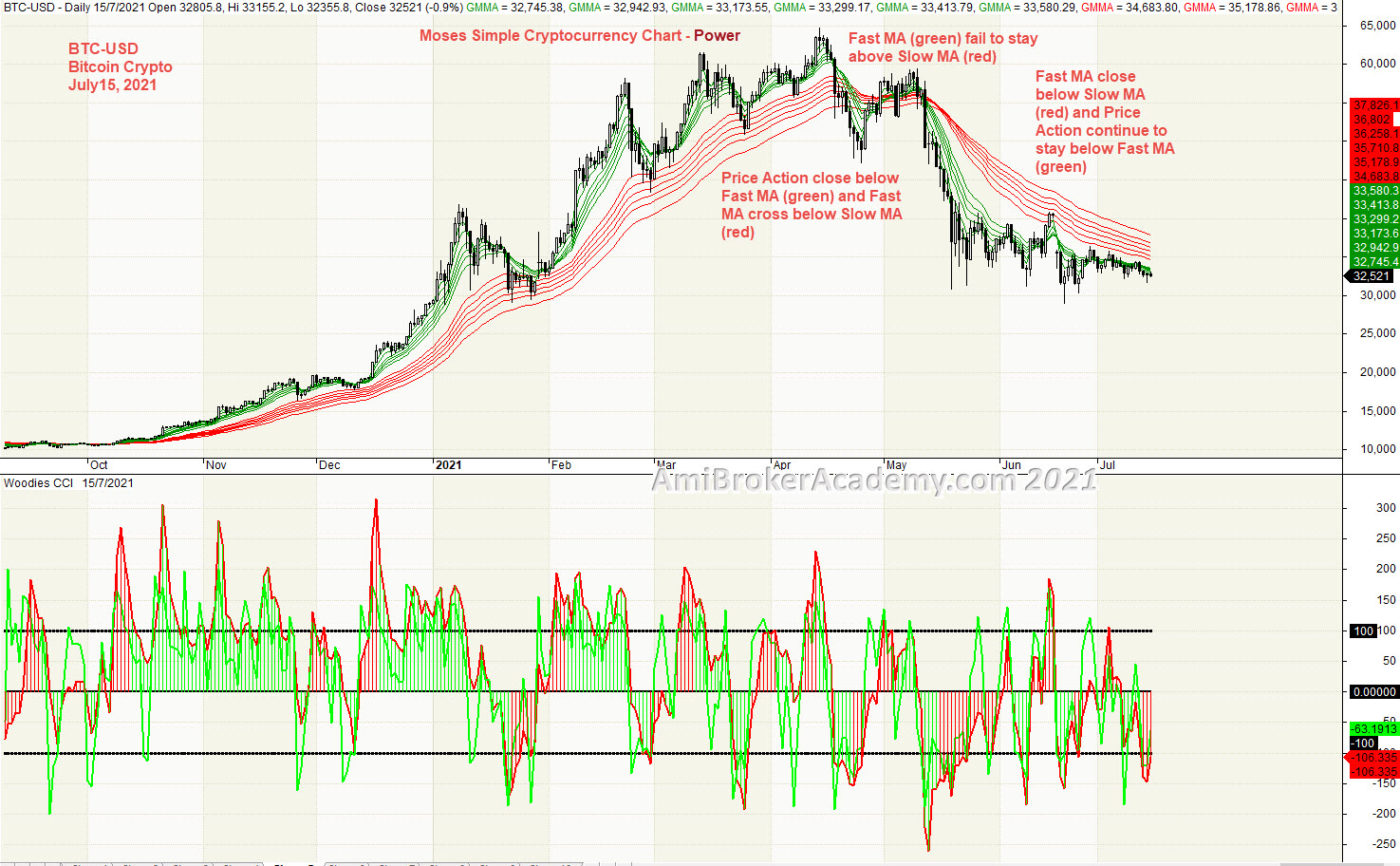
4) Bitcoin Crypto and GMMA and Woodies CCI
Price Action and Fast MA (green) goes from above Slow MA (red) to go below. After April the price action and Fast MA (green) are slopping down. Finally, Fast MA are below Slow MA.
Trade with eyes open.
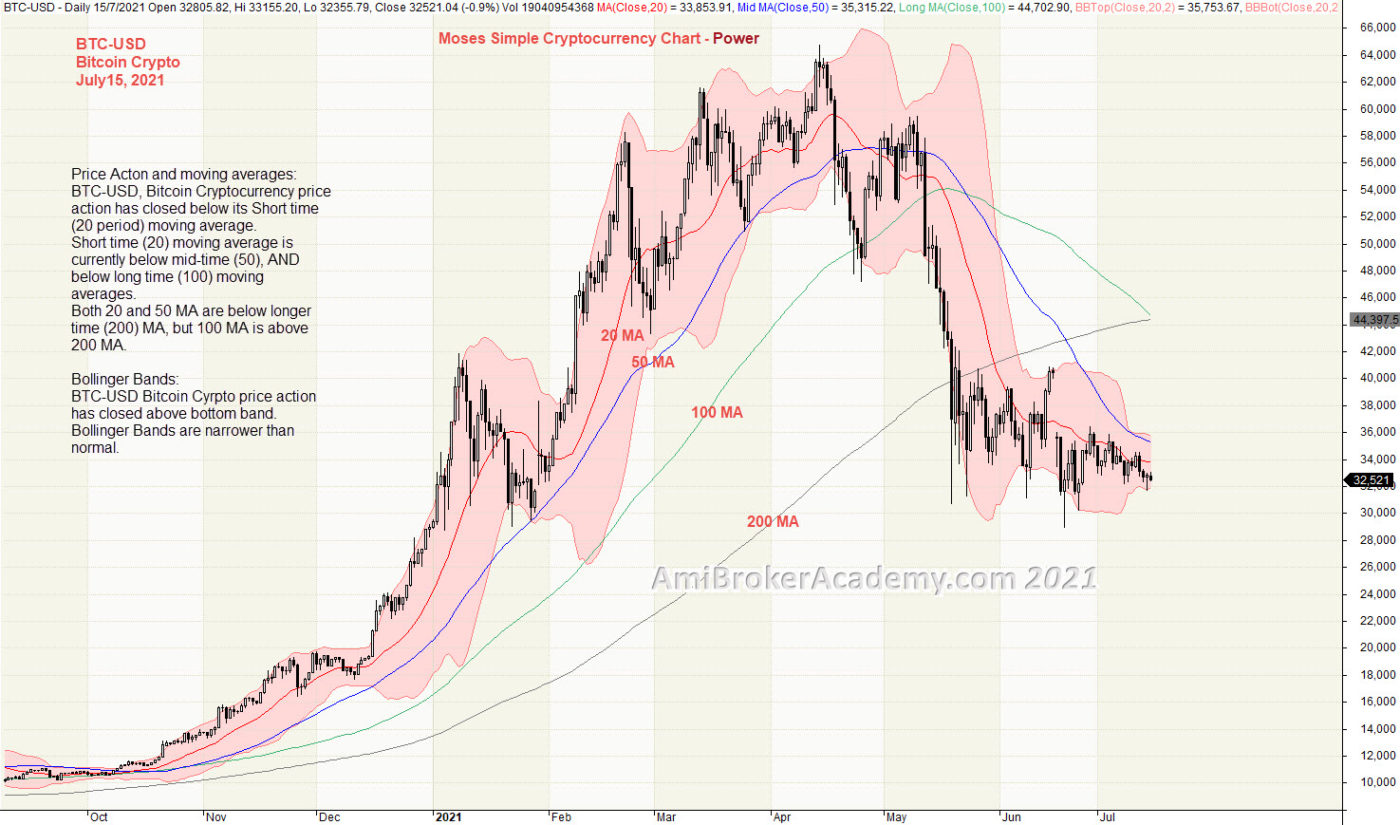
5) Bitcoin Crypto and Bollinger Bands and Moving Averages
Price Acton and moving averages:
BTC-USD, Bitcoin Cryptocurrency price action has closed below its Short time (20 period) moving average.
Short time (20) moving average is currently below mid-time (50), AND below long time (100) moving averages.
Both 20 and 50 MA are below longer time (200) MA, but 100 MA is above 200 MA.
Bollinger Bands:
BTC-USD Bitcoin Cyrpto price action has closed above bottom band.
Bollinger Bands are narrower than normal.
You may also sport a few ABCD patterns. See chart.
Manage your risk.
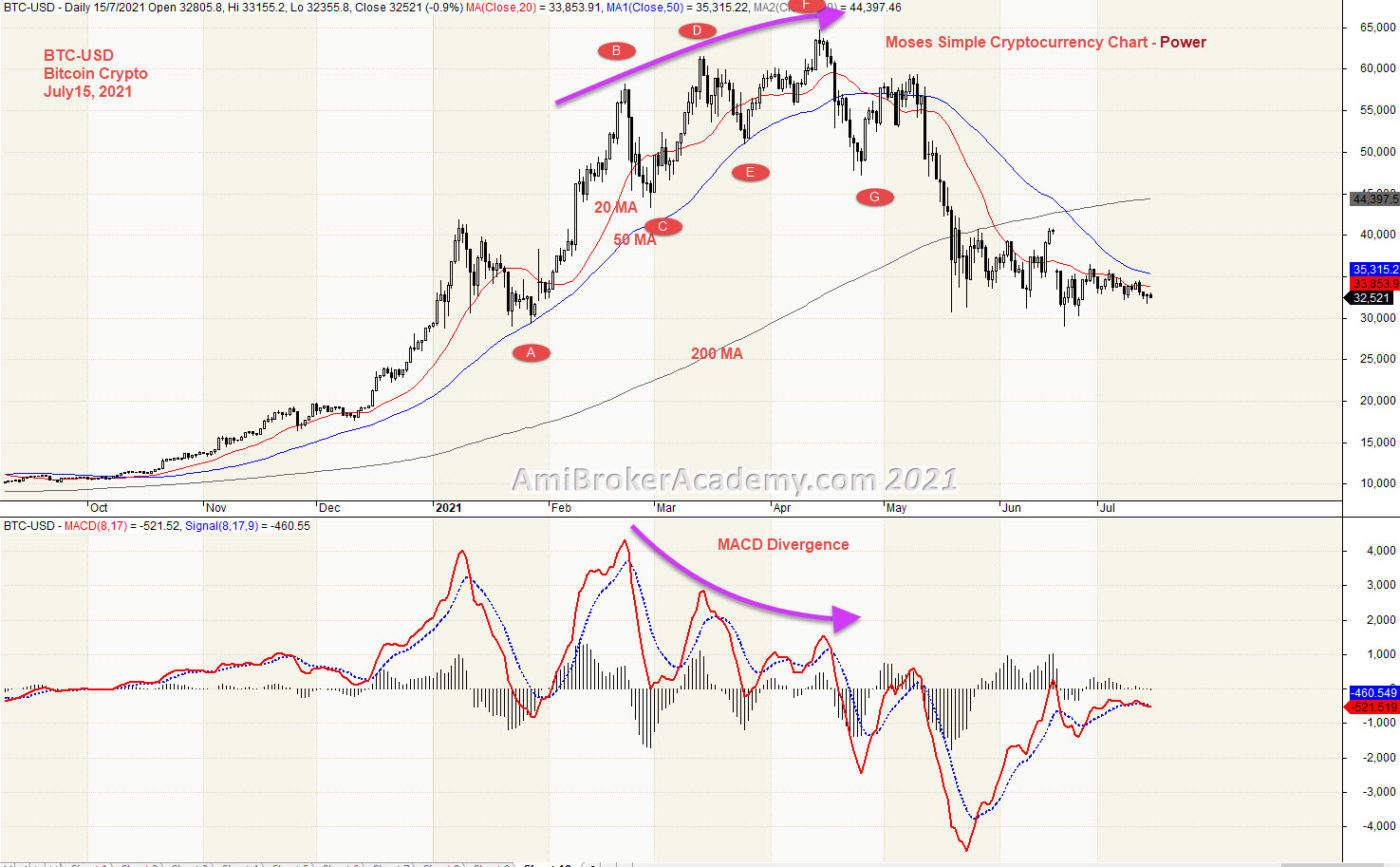
6) Bitcoin Crypto and MACD
We see price action continues to go from low to high, continues to form higher high. 200 MA slopping up. After the MACD Divergence, the price action begin to go lower than the last low. See chart.
Don’t take MACD or MACD-H Divergence lightly. Don’t play play.
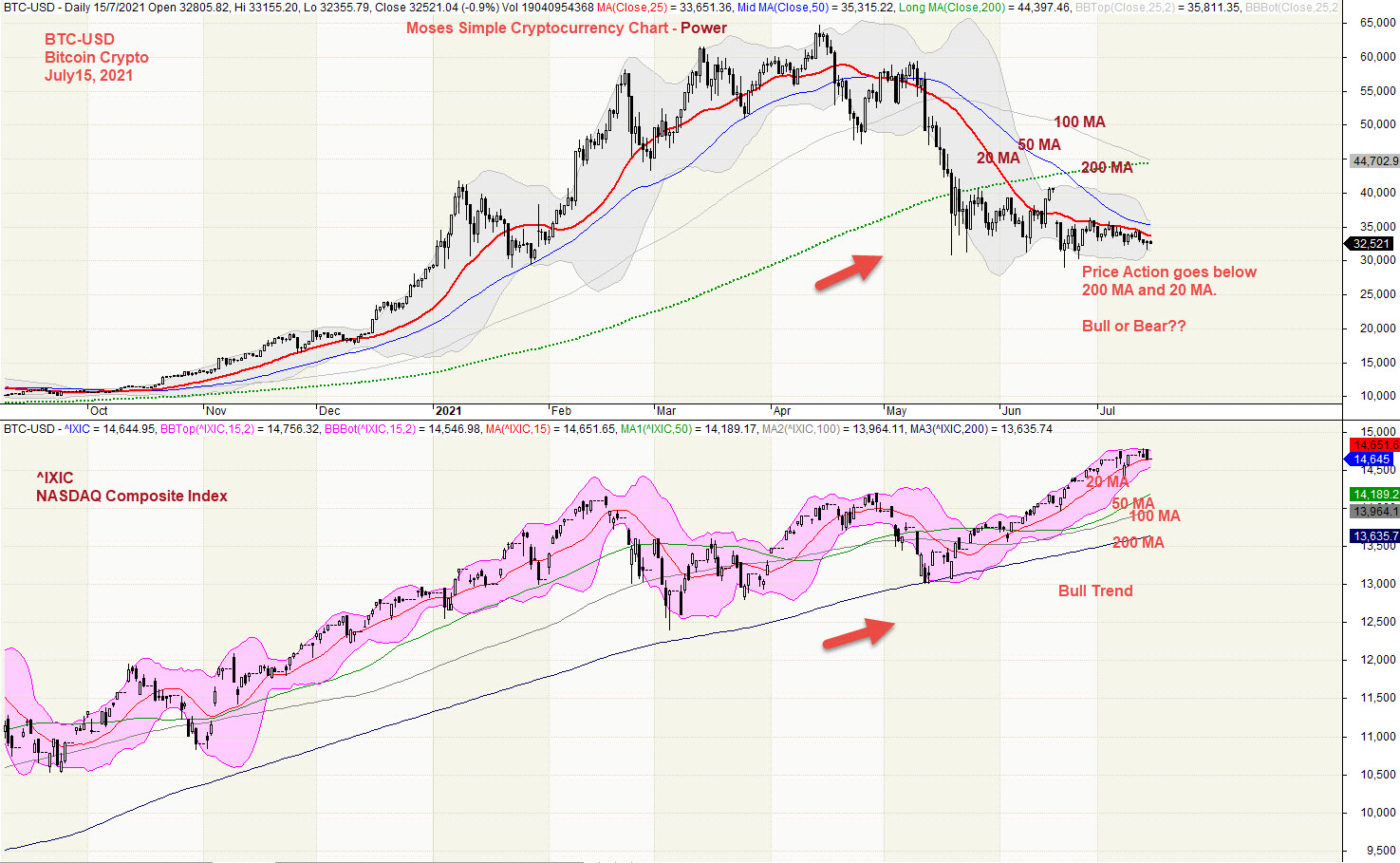
Bitcoin Crypto and NASDAQ Composite Index Correlation
Read our earlier posting on benchmarking the Bitcoin with NASDAQ Index. Have fun!
Moses Power Charting
Official AmiBrokerAcademy.com Charting
Disclaimer
The above result is for illustration purpose. It is not meant to be used for buy or sell decision. We do not recommend any particular stocks. If particular stocks of such are mentioned, they are meant as demonstration of Amibroker as a powerful charting software and MACD. Amibroker can program to scan the stocks for buy and sell signals.
These are script generated signals. Not all scan results are shown here. The MACD signal should use with price action. Users must understand what MACD and price action are all about before using them. If necessary you should attend a course to learn more on Technical Analysis (TA) and Moving Average Convergence Divergence, MACD.
Once again, the website does not guarantee any results or investment return based on the information and instruction you have read here. It should be used as learning aids only and if you decide to trade real money, all trading decision should be your own.
We learn from many past and present great traders. Kudo to these master.