15 July 2021
Welcome!
Welcome to AmiBroker Academy dot com, amibrokeracademy.com.
We sometime bench mark stock price action for two stocks. The following example, we benchmark cryptocurrency, Bitcoin and US stock index, NASDAQ Composite Index. Bticoin crypto is a origin Cryptocurrency in the today crypto market. Besides that we use other tools such as 1) Ichimoku Cloud, 2) Support Resistance (using box), 3) River (moving average), 4) GMMA and Woodies CCI, 5) Bollinger Bands and Moving Averages, and 6) MACD to analyze chart. See our simple reading of price action.
We translate price action chart into layman language. This will help you in understand the financial instrument you are trading. We believe picture worth a thousand words. So, sometimes we use less words. You can learn the price action interpretation too. Give it a tray. You may not have the same view points as us. Remember all analysis read price action chart differently. It is just like reading an essay, we will have different conclusion.
Trade well.
Trade what you see. Manage your risk.
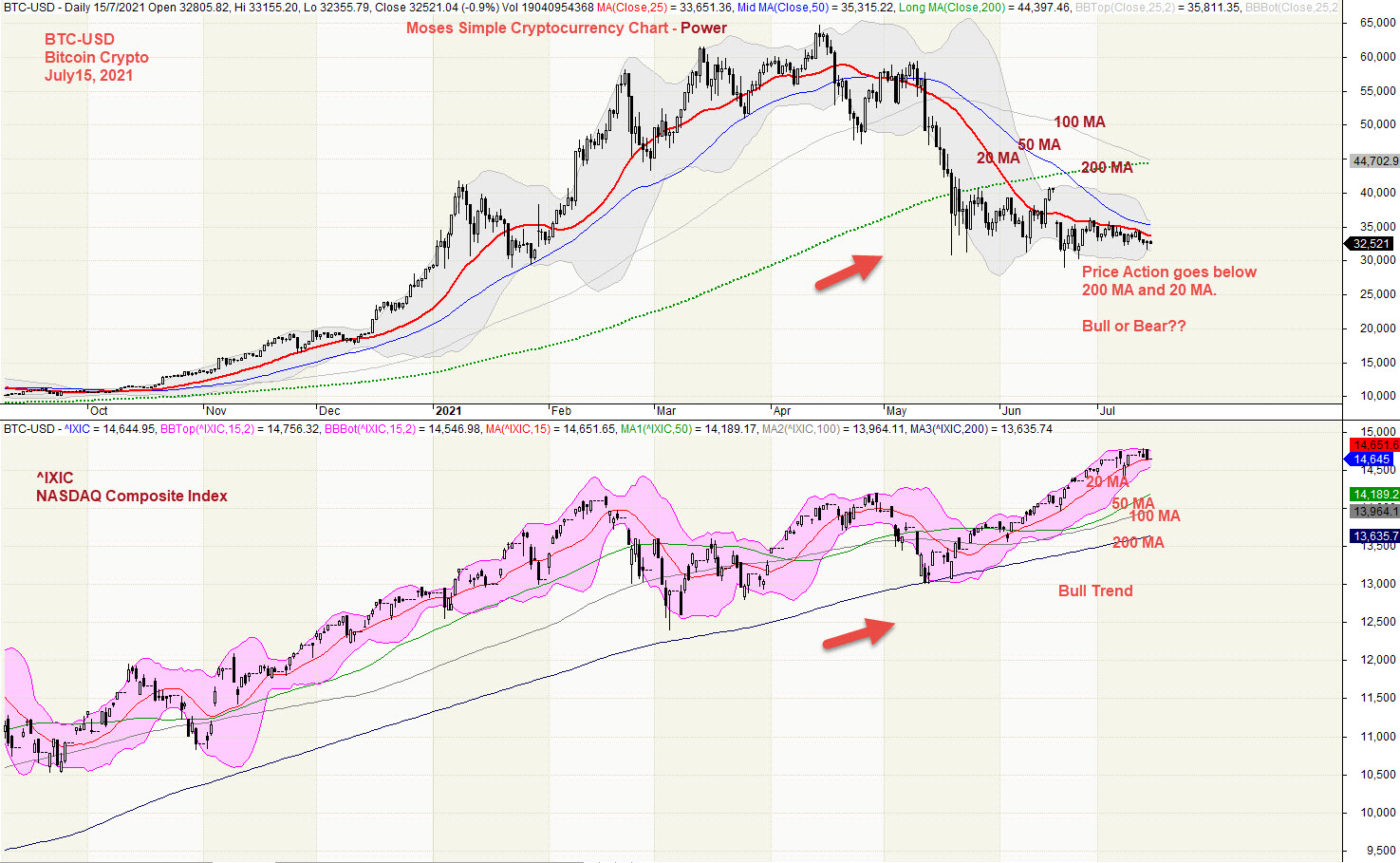
1) Bitcoin Crypto and NASDAQ Composite Index Correlation
We study price action we see Bitcoin Cryptocurrency price action begin to go from low from bottom left to high. Price Action after test the peak and fail, price action begin to pullback. We see NASDAQ Composite Index price action also like Bitcoin goes from low to high, but in between, price action had “rest” and pullback to get support from 200 MA before continue to go higher. Benchmark both Bitcoin and IXIC, you can see Bitcoin has turned from bull to bear, while NASDAQ Index continues to be bullish.
Trade what you see.
Price Action and moving averages:
BTC-USD, Bitcoin Crypto price action has closed below its Short time (20 period) moving average.
Short time (20) moving average is currently below mid-time (50), AND below long time (100) moving averages.
20 and 50 MA are below longer time (200) MA, while 100 MA are just above 200 MA.
Bollinger Bands:
BTC-USD, Bitcoin price action has closed above bottom band.
Bollinger Bands are narrower than normal.
The narrow width of the bands suggests low volatility as compared to normal range. Therefore, the probability of volatility increasing with a sharp price move in the near-term.
Remember, we just read what the chart said. Have fun!
Moses Power Charting
Official AmiBrokerAcademy.com Charting
Disclaimer
The above result is for illustration purpose. It is not meant to be used for buy or sell decision. We do not recommend any particular stocks. If particular stocks of such are mentioned, they are meant as demonstration of Amibroker as a powerful charting software and MACD. Amibroker can program to scan the stocks for buy and sell signals.
These are script generated signals. Not all scan results are shown here. The MACD signal should use with price action. Users must understand what MACD and price action are all about before using them. If necessary you should attend a course to learn more on Technical Analysis (TA) and Moving Average Convergence Divergence, MACD.
Once again, the website does not guarantee any results or investment return based on the information and instruction you have read here. It should be used as learning aids only and if you decide to trade real money, all trading decision should be your own.
We learn from many past and present great traders. Kudo to these master.