May 16, 2018
Shanghai Stock Analysis
600343.SS Shaanxi Aerospace Power Hi-Tech Co 航天动力 and Moving Average and Bollinger Bands
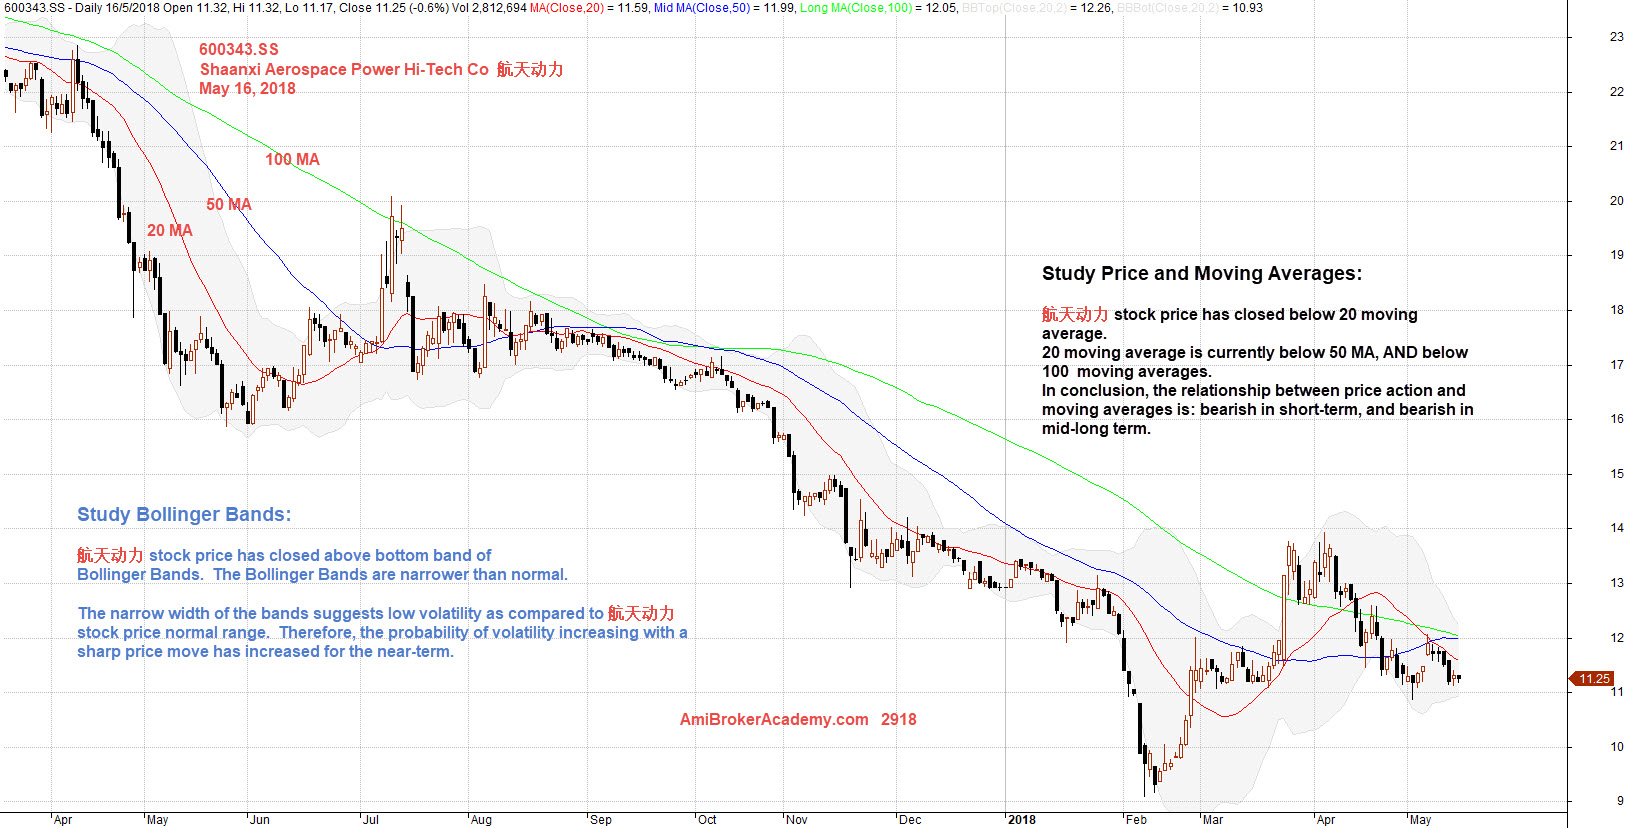
Picture worth a thousand words, see chart. We study Shaanxi Aerospace Power Hi-Tech Co 航天动力 using moving average and Bollinger Bands. Use 20, 50 and 100 MAs, and standard 20 Bollinger Bands.
Moving Average MA
We see the price action of 航天动力 stock price has closed below 20 moving average. 20 moving average is currently below 50 MA, AND below 100 moving averages.
In conclusion, the relationship between price action and moving averages is: bearish in short-term, and bearish in mid-long term.
Bollinger Bands BB
Next we study Shaanxi Aerospace Power Hi-Tech Co 航天动力 stock price using Bollinger Bands:
航天动力 stock price has closed above bottom band of 20 Bollinger Bands. The Bollinger Bands are narrower than normal, compare the earlier display, see chart for more.
The narrow width of the bands suggests a low volatility as compared to 航天动力 stock price on the normal range. Therefore, the probability of volatility increasing with a sharp price move has increased for the near-term.
Manage your risk.
May 16, 2018 Shaanxi Aerospace Power Hi-Tech Co 航天动力 and MA and Bollinger Bands
Powerful Chart Software – AmiBroker
The following chart is produced using AmiBroker charting software. It is a powerful chart software. You plot the stocks you are interested all in one chart, as long as you still could read them. See chart below.
600343.SS Shaanxi Aerospace Power Hi-Tech Co 航天动力 From Day One
To understand the stock, you can always zoom out to see the stock from day one. Picture worth a thousand words. See chart for more.
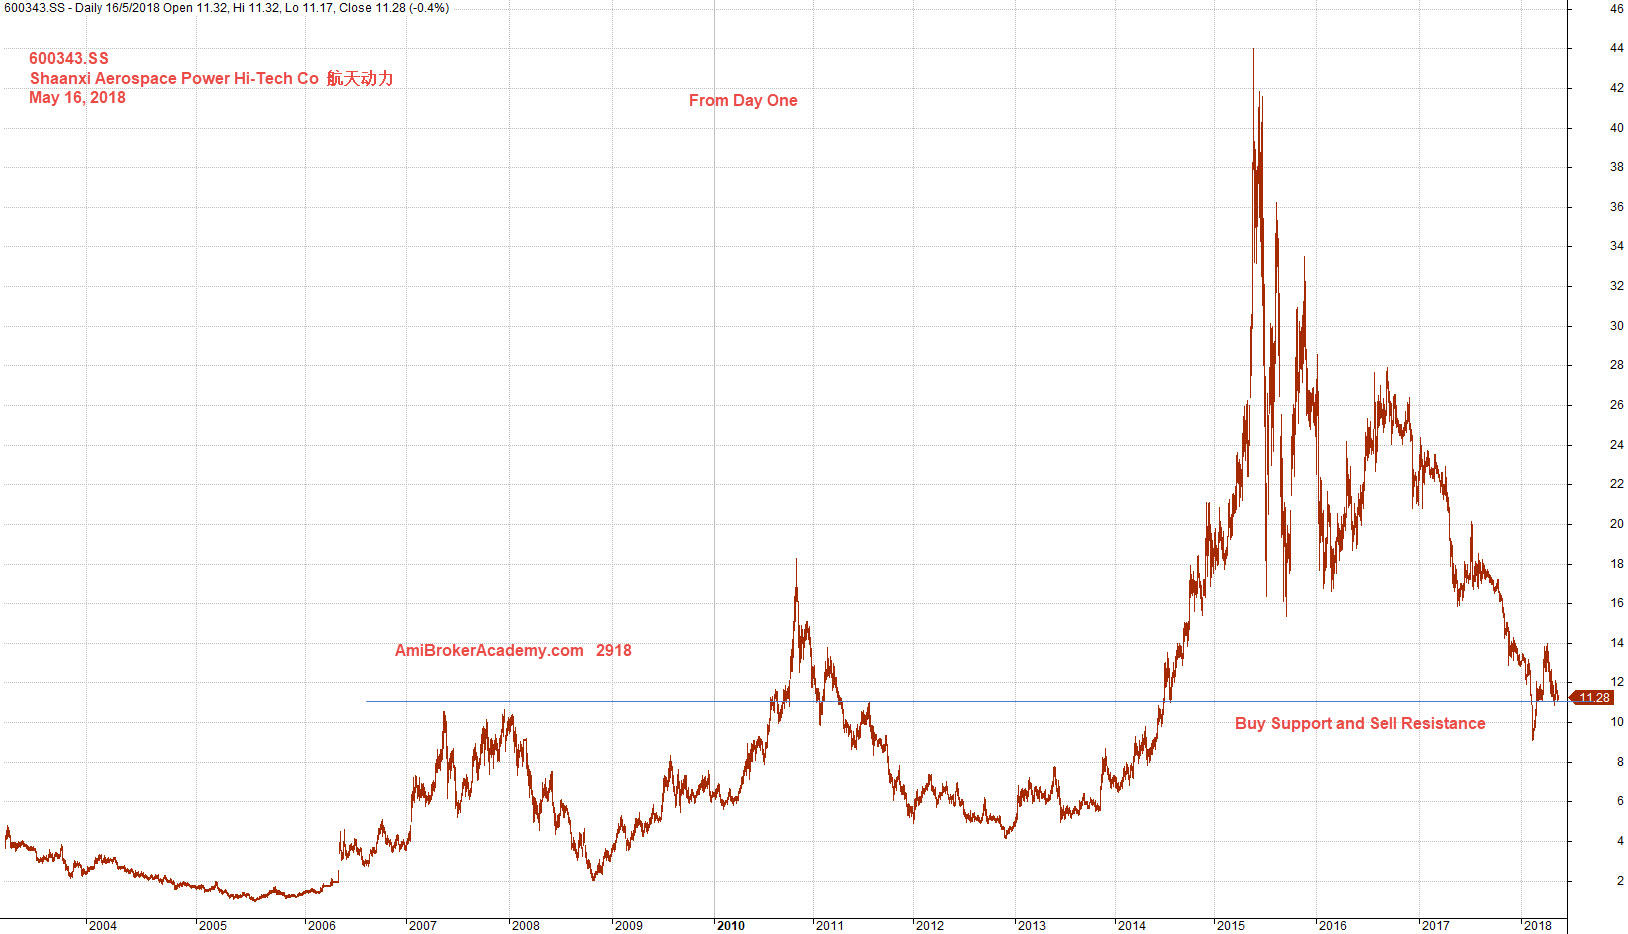
May 16, 2018 Shaanxi Aerospace Power Hi-Tech Co 航天动力 from Day One
Moses
AmiBrokerAcademy.com
Disclaimer
The above result is for illustration purpose. It is not meant to be used for buy or sell decision. We do not recommend any particular stocks. If particular stocks of such are mentioned, they are meant as demonstration of Amibroker as a powerful charting software and MACD. Amibroker can program to scan the stocks for buy and sell signals.
These are script generated signals. Not all scan results are shown here. The MACD signal should use with price action. Users must understand what MACD and price action are all about before using them. If necessary you should attend a course to learn more on Technical Analysis (TA) and Moving Average Convergence Divergence, MACD.
Once again, the website does not guarantee any results or investment return based on the information and instruction you have read here. It should be used as learning aids only and if you decide to trade real money, all trading decision should be your own.