16 May, 2018
We ask you in April 1, Is It A Good Time to Buy? While we did the analysis again on May 1. Did you study and buy?
Now let look at the stock price again. We will use a different approach to study Facebook stock this time. Have fun!
We combine moving average and bollinger bands.
US Stock Chart Analysis
FB Facebook Inc Price Action Using Moving Average and Bollinger Bands
Study Facebook Inc stock price using moving average and bollinger bands.
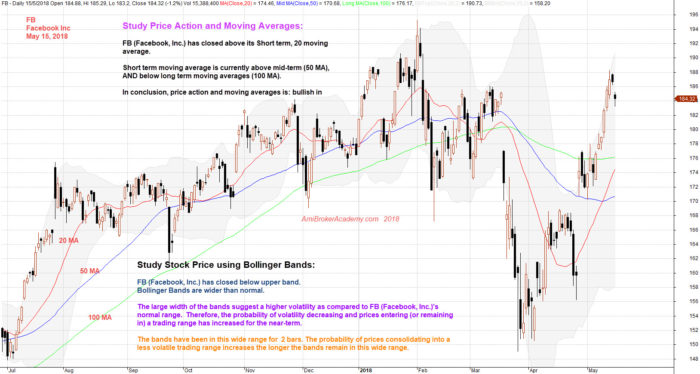
Study Facebook Price Action and Moving Averages:
FB (Facebook, Inc.) has closed above its Short term, 20 moving average.
Short term moving average is currently above mid-term (50 MA), AND below long term moving averages (100 MA).
In conclusion, price action and moving averages is: bullish in short-term, and neutral in mid-long term.
Study Facebook Inc Stock Price using Bollinger Bands:
FB (Facebook, Inc.) has closed below upper band. See chart, Bollinger Bands are wider than normal. Picture worth a thousand words.
The large width of the bands suggest a higher volatility as compared to FB (Facebook, Inc.)’s normal range. Therefore, the probability of volatility decreasing and prices entering (or remaining in) a trading range has increased for the near-term.
The bands have been in this wide range for 2 bars. The probability of prices consolidating into a less volatile trading range increases the longer the bands remain in this wide range.
Manage your risk!
Remember all setup can fail.
Powerful Chart Software – AmiBroker
The following chart is produced using AmiBroker charting software. It is a powerful chart software. Anything, finance ticket you could download from Yahoo! Finance you could plot them, those you are interested all in a chart, so you could analyse them.
May 15, 2018 Facebook Inc and Moving Average and Bollinger Band
The chart of last posting.
Moses US Stock Chart Analysis
AmiBrokerAcademy.com
Disclaimer
The above result is for illustration purpose. It is not meant to be used for buy or sell decision. We do not recommend any particular stocks. If particular stocks of such are mentioned, they are meant as demonstration of Amibroker as a powerful charting software and MACD. Amibroker can program to scan the stocks for buy and sell signals.
These are script generated signals. Not all scan results are shown here. The MACD signal should use with price action. Users must understand what MACD and price action are all about before using them. If necessary you should attend a course to learn more on Technical Analysis (TA) and Moving Average Convergence Divergence, MACD.
Once again, the website does not guarantee any results or investment return based on the information and instruction you have read here. It should be used as learning aids only and if you decide to trade real money, all trading decision should be your own.