19 September, 2018
Thanks for visiting the site.
Moses Stock Stories – Thinking Out Loud
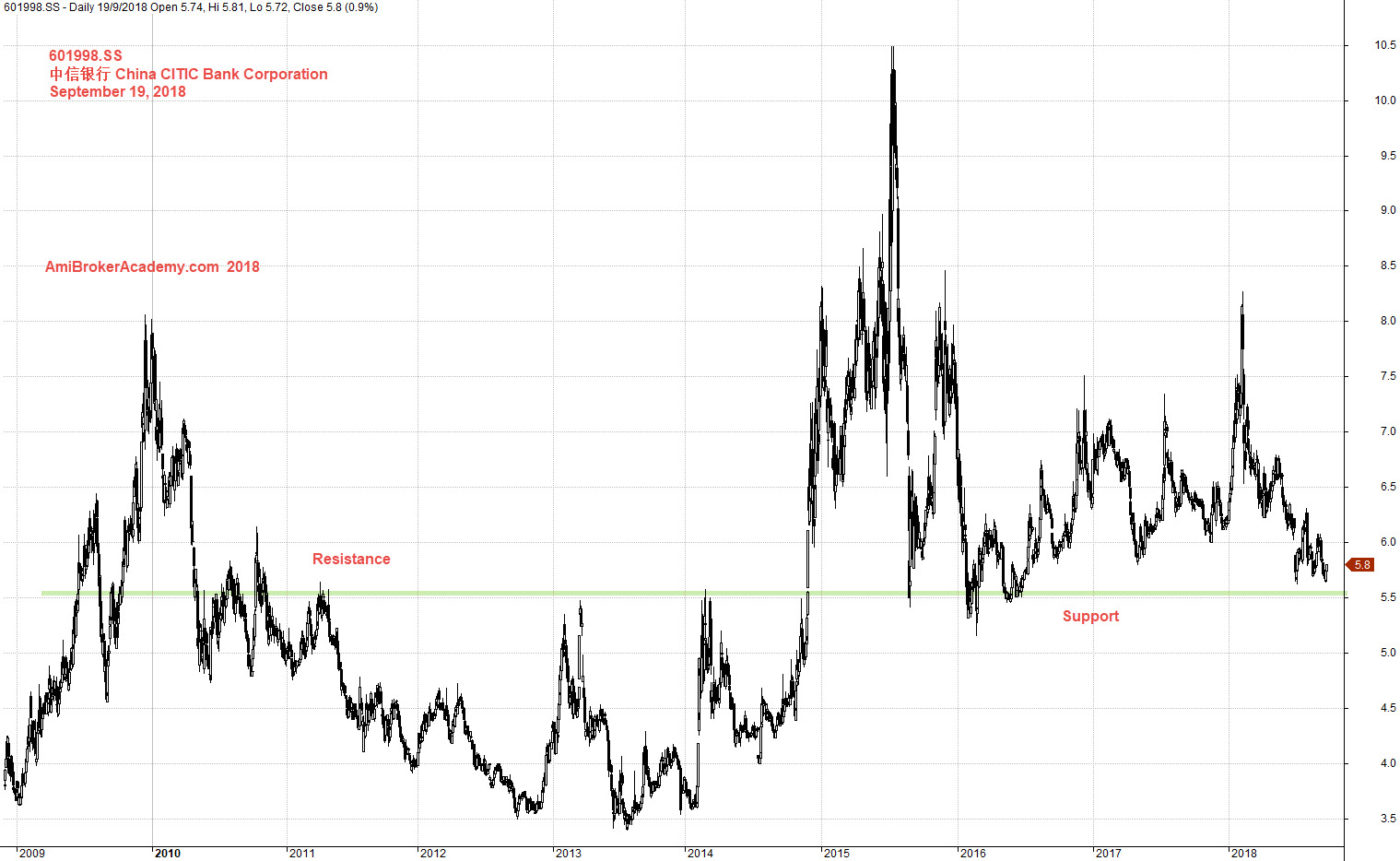
601998.SS 中信银行 China CITIC Bank Corporation Charting
Image you bought 中信银行 China CITIC Bank Corporation stock in 2010 at the start of the year, and you still not sell any until today. You will probably very mad. May trader like to buy stock at the start of the year. As a trader you should always trade in buy support and sell resistance and not so fix by just follow the calendar.
Study 中信银行 China CITIC Bank Corporation from 2010. See chart, we see a bear trend, touch the low in 2012 near 3.5, and retest the 3.5 again in the next year before the stock price take off into bull trend.
The trouble is you did not follow another rule in trading, taking profit when price action begin to breakout below bull trendline.
Anyway, anything is not done is not done. In trading there is no right no wrong. Just do your technical analysis.
Manage Your Risk!
September 19, 2018 中信银行 China CITIC Bank Corporation Charting
If you can see the whole chart, “press Ctrl and -” to zoom out to see the entire chart.
Zoom in, and add an indicator like MACD. What can you trade using MACD signal? See chart, picture worth a thousand words. Manage your risk.
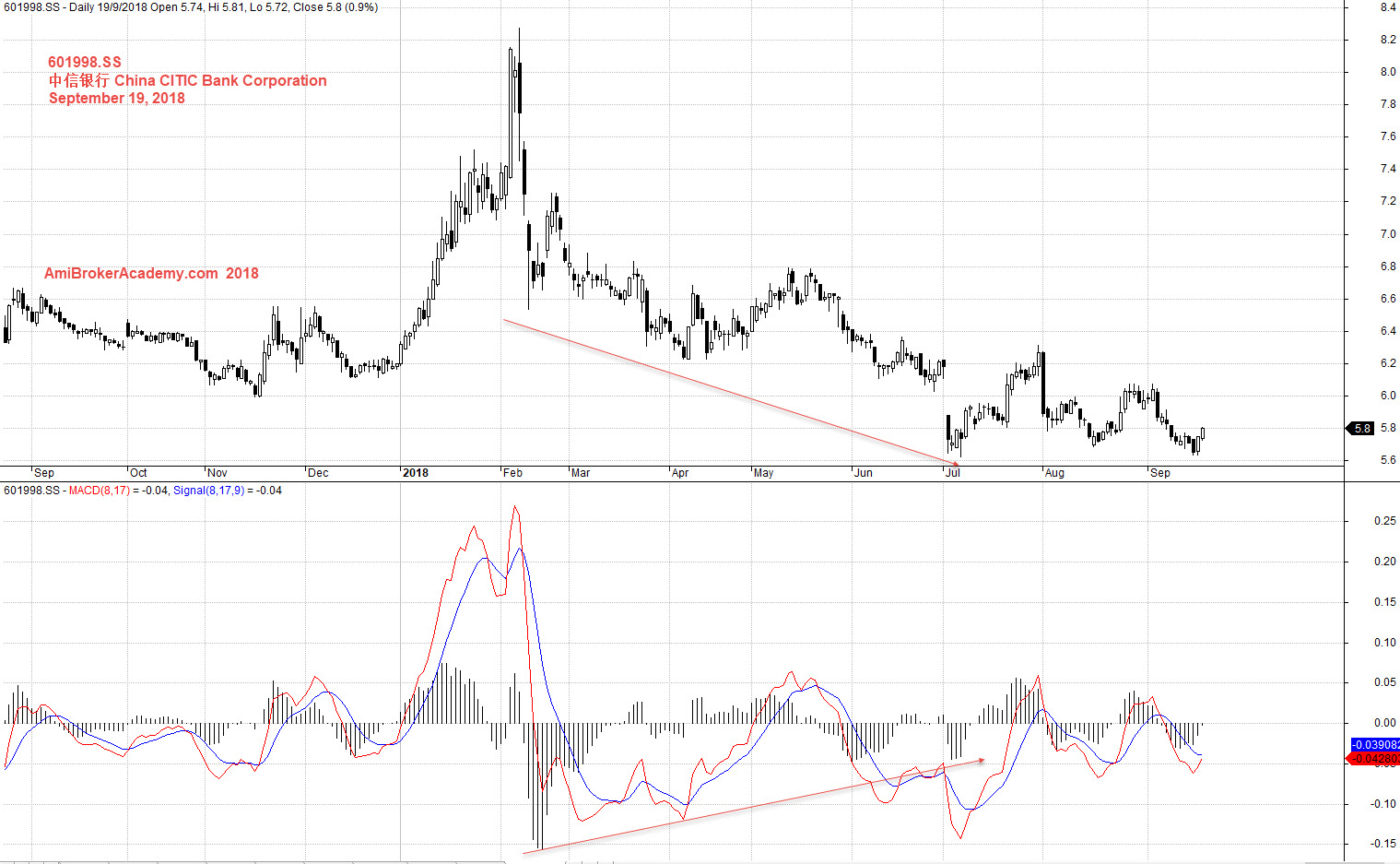
September 19, 2018 中信银行 China CITIC Bank Corporation and MACD
If you don’t like MACD, try Stochastic. We use two Stochastic here, a fast and slow Stochastic, so we could appreciate the price action better. What can you trade using Stochastic signal? See chart, picture worth a thousand words. Manage your risk.
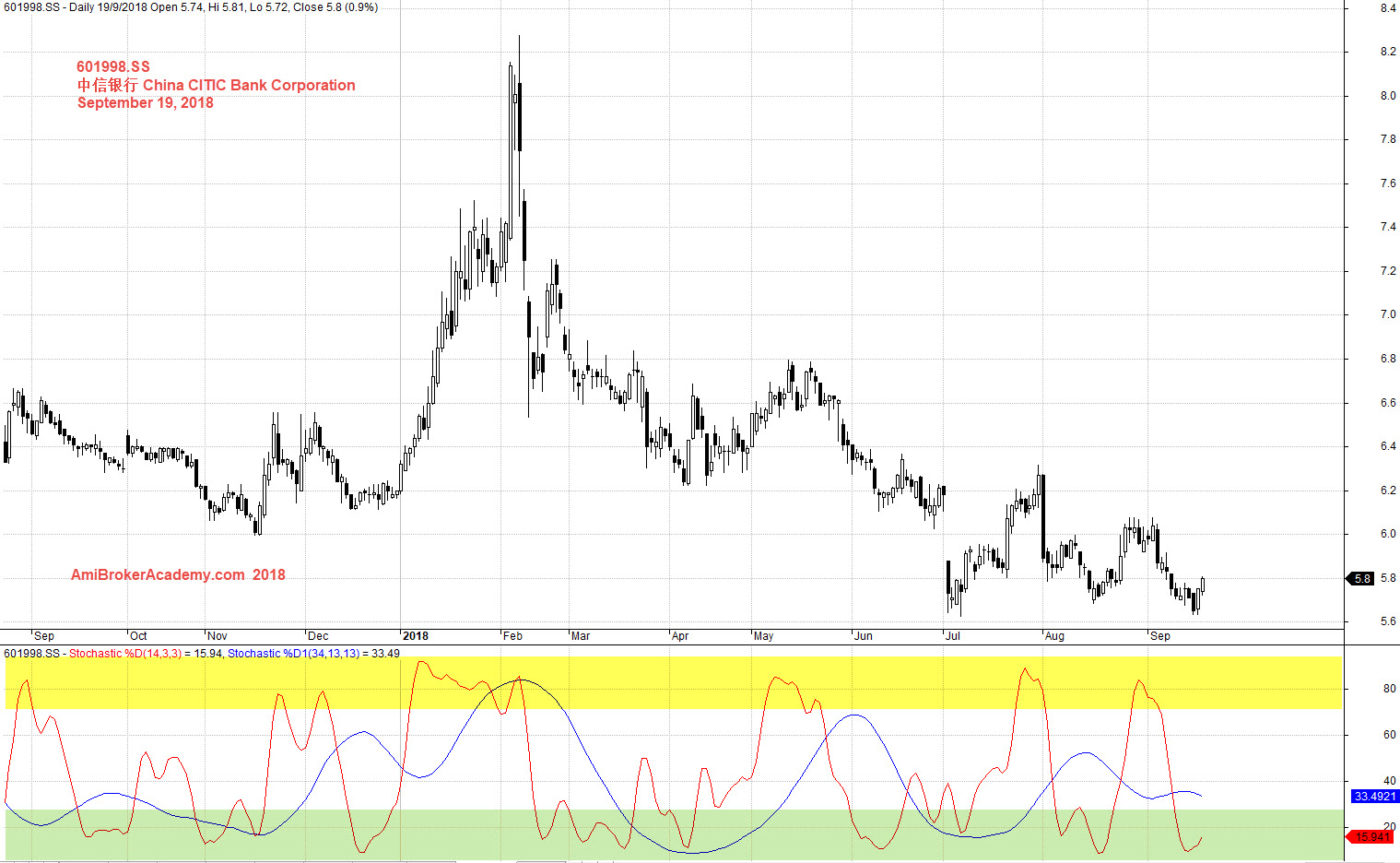
September 19, 2018 中信银行 China CITIC Bank Corporation and Stochastic
Moses
AmiBrokerAcademy.com
Disclaimer
The above result is for illustration purpose. It is not meant to be used for buy or sell decision. We do not recommend any particular stocks. If particular stocks of such are mentioned, they are meant as demonstration of Amibroker as a powerful charting software and MACD. Amibroker can program to scan the stocks for buy and sell signals.
These are script generated signals. Not all scan results are shown here. The MACD signal should use with price action. Users must understand what MACD and price action are all about before using them. If necessary you should attend a course to learn more on Technical Analysis (TA) and Moving Average Convergence Divergence, MACD.
Once again, the website does not guarantee any results or investment return based on the information and instruction you have read here. It should be used as learning aids only and if you decide to trade real money, all trading decision should be your own.