19 September, 2018
Thanks for visiting the site.
Moses Stock Stories – Think Think Got More Things
601998.SS 中信银行 China CITIC Bank Corporation and SSEC Correlation
We posted the 中信银行 China CITIC Bank Corporation charting and chart with MACD and Stochastic. If we will benchmark the stock with Shanghai Stock Exchange Index. What can you get? See the next two charts.
Manage Your Risk!
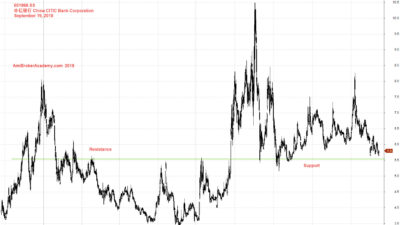
September 19, 2018 中信银行 China CITIC Bank Corporation Charting
See the correlation of 中信银行 China CITIC Bank Corporation and Shanghai Stock Exchange Composite Index.
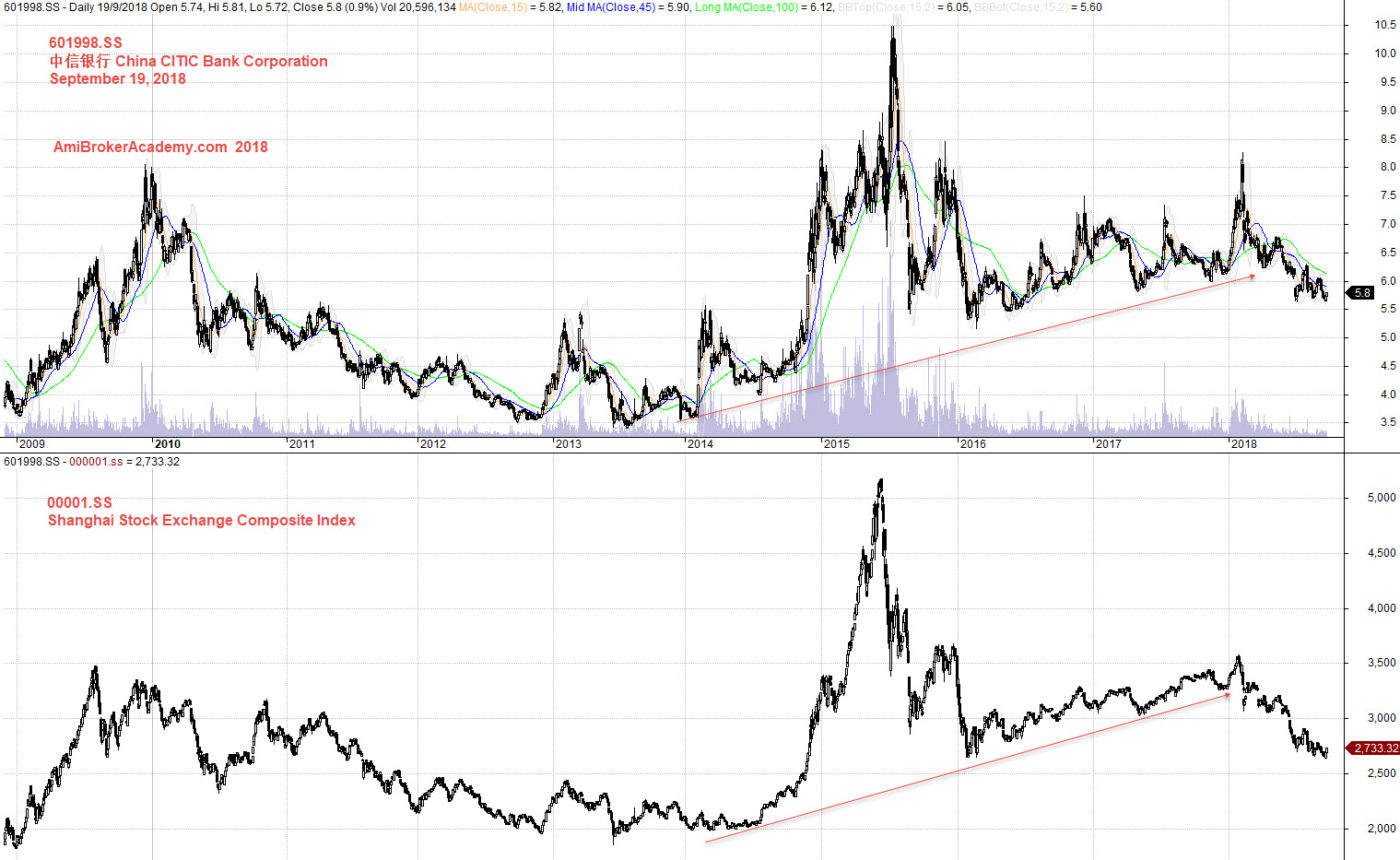
September 19, 2018 中信银行 China CITIC Bank Corporation and SSEC Correlation
If you can see the whole chart, “press Ctrl and -” to zoom out to see the entire chart.
Let’s zoom in, and see the chart from 2015. What correlation between the two? Trade with your eyes open. Manage your risk.
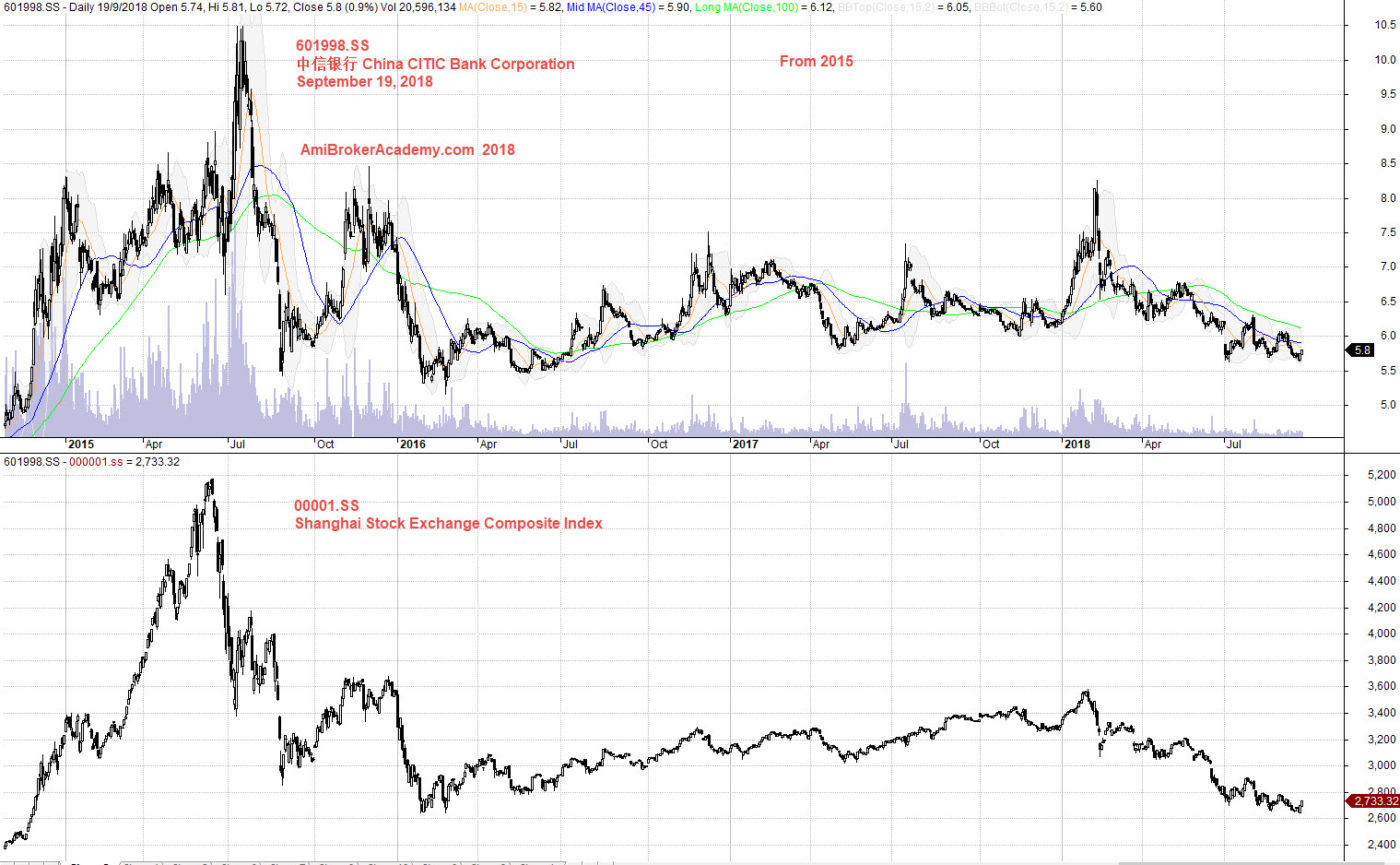
September 19, 2018 中信银行 China CITIC Bank Corporation and SSEC Correlation Zoom In
Moses
AmiBrokerAcademy.com
Disclaimer
The above result is for illustration purpose. It is not meant to be used for buy or sell decision. We do not recommend any particular stocks. If particular stocks of such are mentioned, they are meant as demonstration of Amibroker as a powerful charting software and MACD. Amibroker can program to scan the stocks for buy and sell signals.
These are script generated signals. Not all scan results are shown here. The MACD signal should use with price action. Users must understand what MACD and price action are all about before using them. If necessary you should attend a course to learn more on Technical Analysis (TA) and Moving Average Convergence Divergence, MACD.
Once again, the website does not guarantee any results or investment return based on the information and instruction you have read here. It should be used as learning aids only and if you decide to trade real money, all trading decision should be your own.