16 September, 2018
Thanks for visiting the site.
Moses Stock Stories – Thinking Out Loud
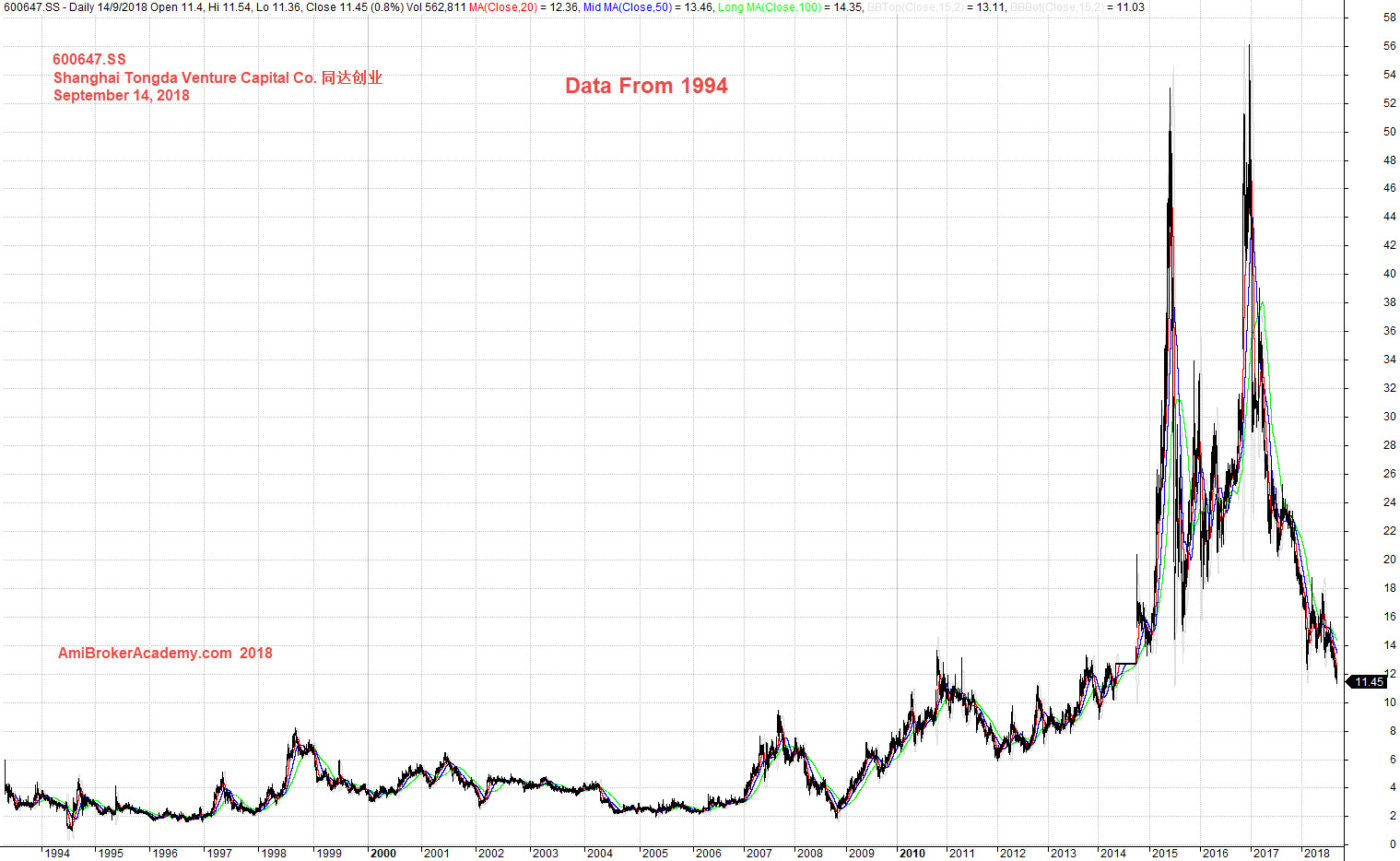
600647.SS Shanghai Tongda Venture Capital Co. 同达创业 Charting From 1994
Buy Support Sell Resistance.
Study Shanghai Tongda Venture Capital Co. 同达创业 stock price, see chart picture worth a thousand words. The stock price is very choppy from 2015 or more correct is volatile. It is very difficult to trade when it is volatile.
In technical analysis, the key is cut lost quick and take profit as you go. When the stock fail to achieve going higher, and it is a great idea to protect your profit.
So, if you can identify support and resistance, this will be your best reference for buy or sell. There is no right no wrong in trading. So trade with eyes open. Do not ask around for best buy or sell?
The stock price started low from 1994 to 2009, and began to become bull trend. Peak in 56 in 2016, now the price action return to below 12. If you apply the buy hold strategy, and not yet taking any profit near the peak. You probably will be very mad about yourself. In trading, you do not just buy good stock. But also remember to take profit too. Trade with your eyes open.
Manage Your Risk!
September 14, 2018 Shanghai Tongda Venture Capital Co. 同达创业 from 1994
If you can see the whole chart, “press Ctrl and -” to zoom out.
Let’s focus the stock from 2016, and study the stock price. See chart, picture worth a thousand words. We have already express our thought on how you should trade. Trade with your eyes open. Mange your risk well, reduce your risk by taking profit along the way.
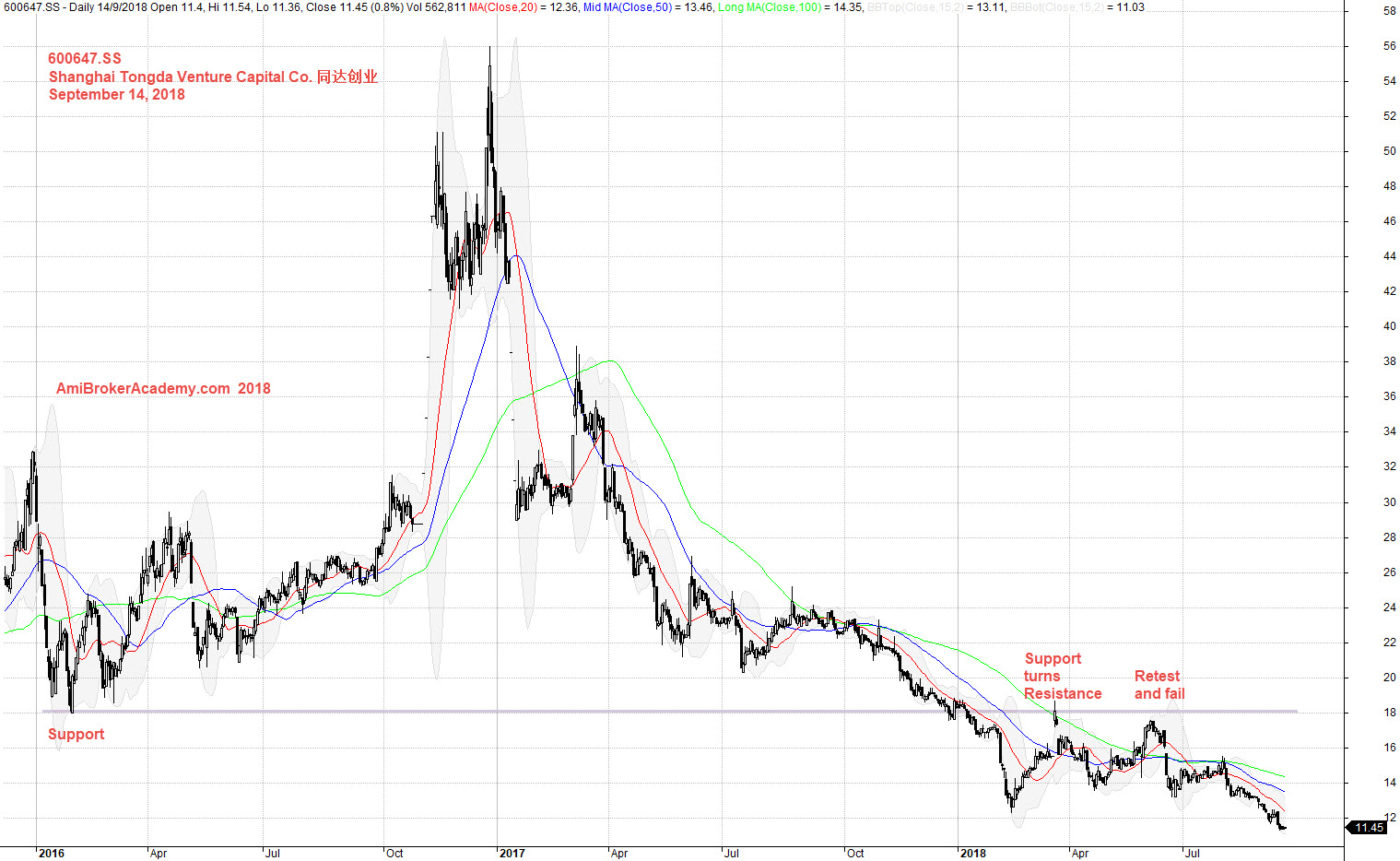
September 14, 2018 Shanghai Tongda Venture Capital Co. 同达创业Support Turns Resistance
Add MACD indicator, see chart picture worth a thousand words.
Trade with eyes open.
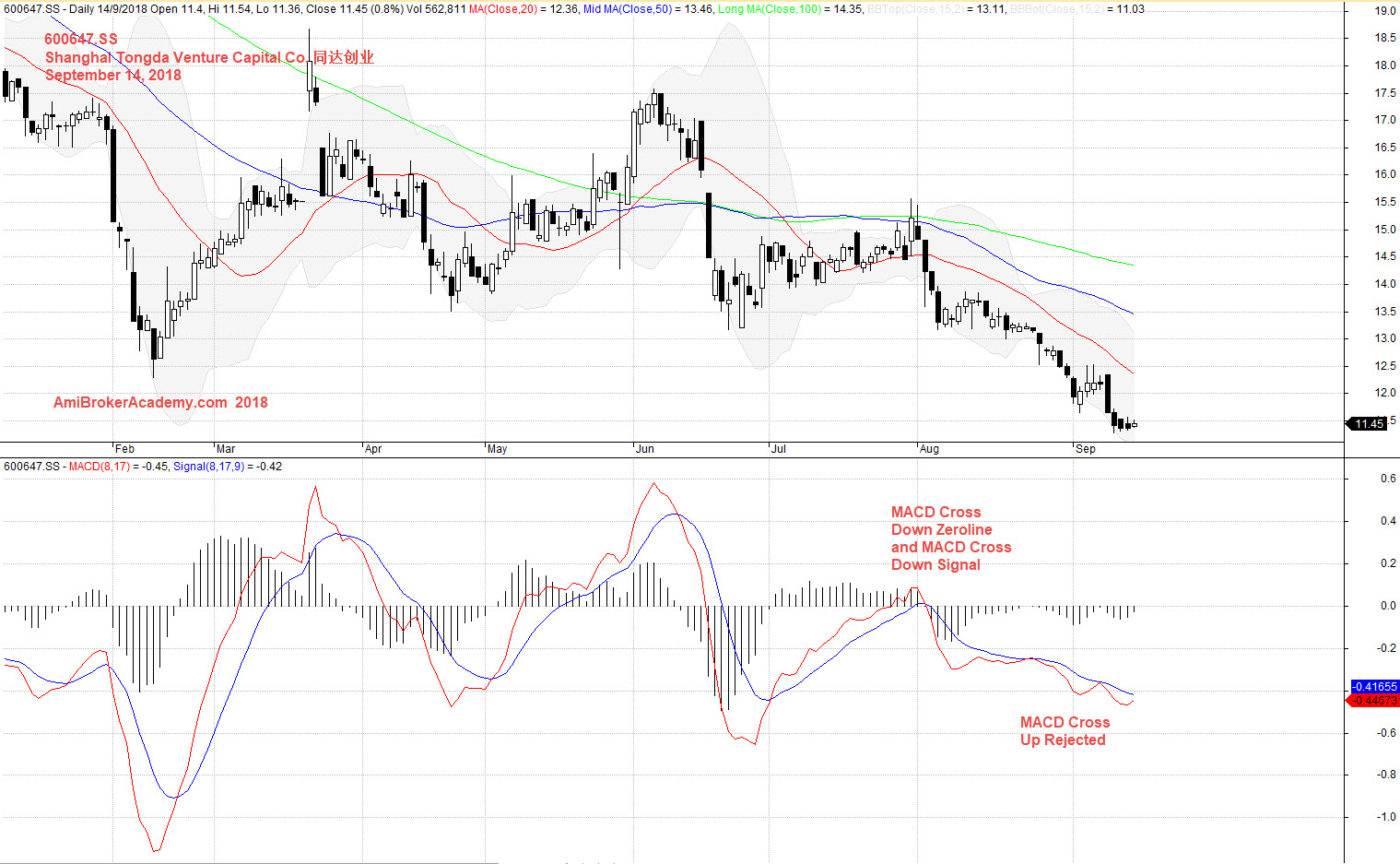
September 14, 2018 Shanghai Tongda Venture Capital Co. 同达创业 and MACD
Moses
AmiBrokerAcademy.com
Disclaimer
The above result is for illustration purpose. It is not meant to be used for buy or sell decision. We do not recommend any particular stocks. If particular stocks of such are mentioned, they are meant as demonstration of Amibroker as a powerful charting software and MACD. Amibroker can program to scan the stocks for buy and sell signals.
These are script generated signals. Not all scan results are shown here. The MACD signal should use with price action. Users must understand what MACD and price action are all about before using them. If necessary you should attend a course to learn more on Technical Analysis (TA) and Moving Average Convergence Divergence, MACD.
Once again, the website does not guarantee any results or investment return based on the information and instruction you have read here. It should be used as learning aids only and if you decide to trade real money, all trading decision should be your own.