July 4, 2018
Thanks for visiting the site.
One Secret I did not tell others. After the sideways the breakout will be big. The longer the sideways the stronger the breakout. This secret only for those read every single words on my post. Have fun make money.
See the example below on the breakout trade.
Shanghai Stock Analysis – Trade with Eyes Open
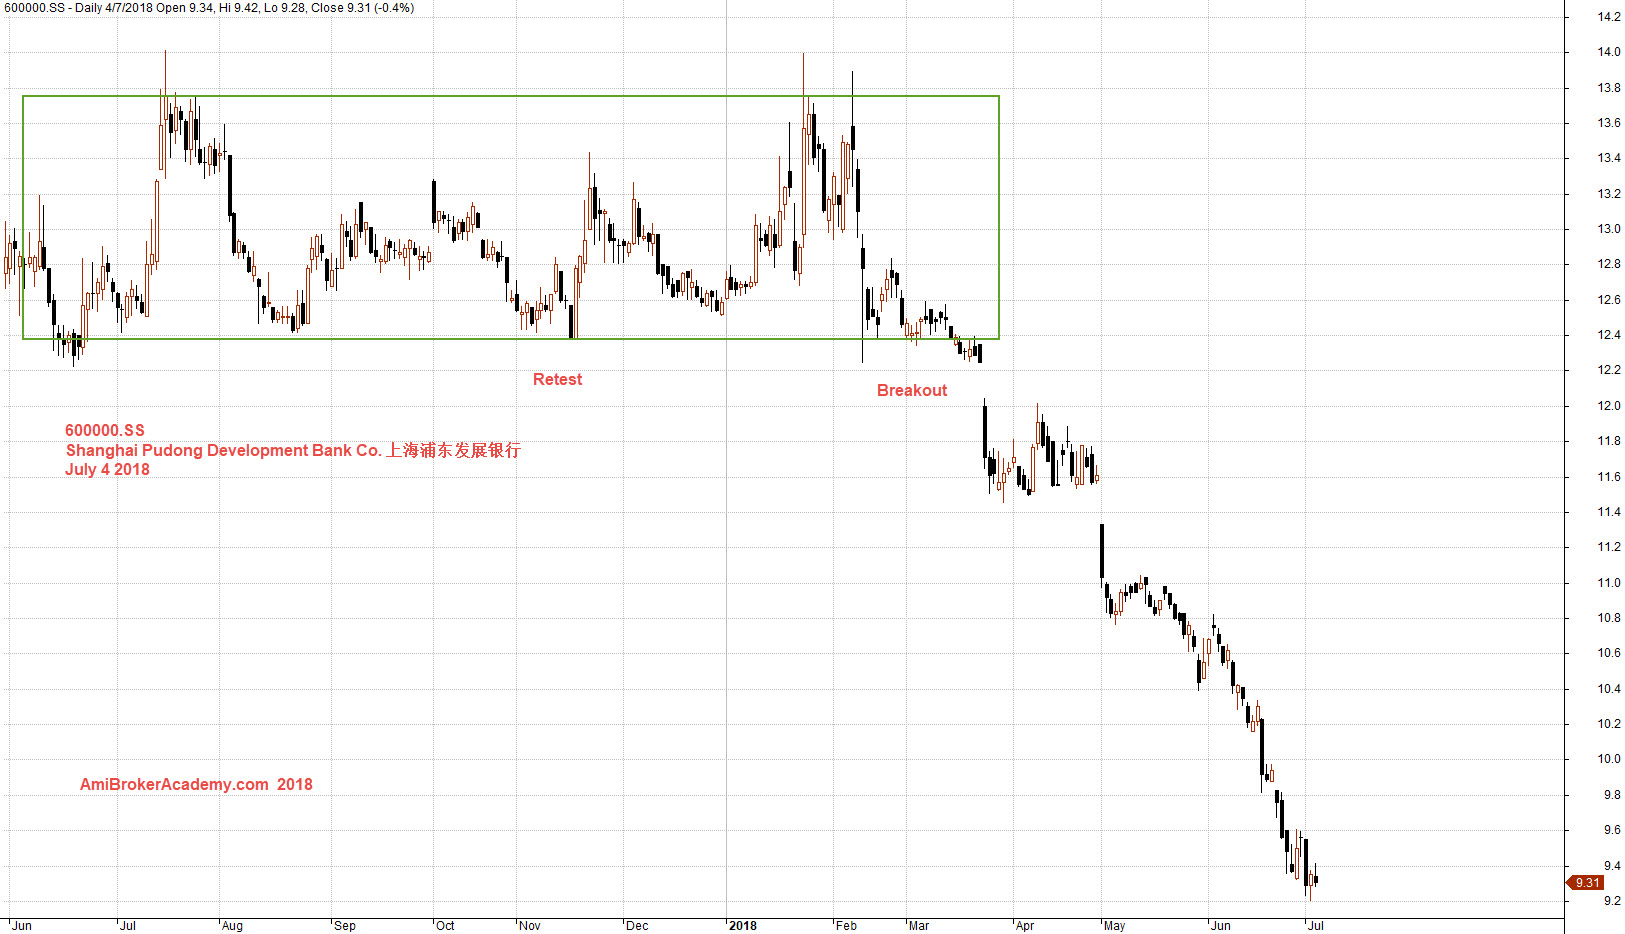
Shanghai Pudong Development Bank Co. 上海浦东发展银行 Charting and Breakout
To learn how to trade first is to understand the signals given by the chart.
The market can only move up or down, if it is not up or down the market is sideways.
Study Shanghai Pudong Development Bank Co. 上海浦东发展银行 stock chart. See the breakout after the sideways.
July 4, 2018 Shanghai Pudong Development Bank Co. 上海浦东发展银行 and Breakout
Moses
AmiBrokerAcademy.com
Disclaimer
The above result is for illustration purpose. It is not meant to be used for buy or sell decision. We do not recommend any particular stocks. If particular stocks of such are mentioned, they are meant as demonstration of Amibroker as a powerful charting software and MACD. Amibroker can program to scan the stocks for buy and sell signals.
These are script generated signals. Not all scan results are shown here. The MACD signal should use with price action. Users must understand what MACD and price action are all about before using them. If necessary you should attend a course to learn more on Technical Analysis (TA) and Moving Average Convergence Divergence, MACD.
Once again, the website does not guarantee any results or investment return based on the information and instruction you have read here. It should be used as learning aids only and if you decide to trade real money, all trading decision should be your own.