4 July, 2018
Thanks for visiting the site.
Study the last six months and plan for the next six months.
Moses Stock Chart Analysis
^AXJO Australia S&P ASX 200 Index Stock Charting
Study the stock chart of Australia S&P ASX 200 Index half year high low, from the box we added we can see 2018 1st half is more bullish than 2017 2nd half.
S&P ASX 200 was first pullback at the start of the year and then bounce up. The high was higher than January high.
Manage your risk.
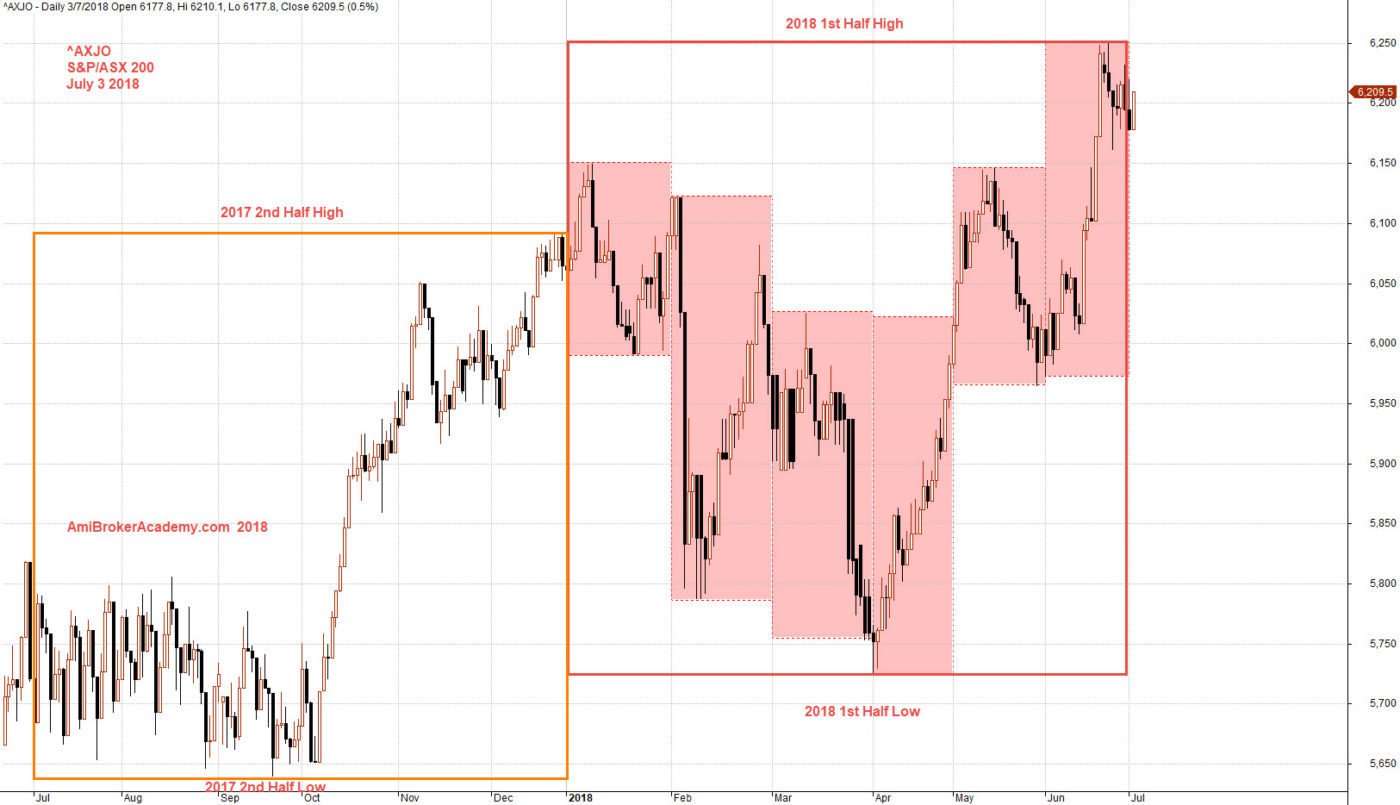
July 3, 2018 Australia S&P ASX 200 Half Year High Low
Moses Stock Chart Analysis
AmiBrokerAcademy.com
Disclaimer
The above result is for illustration purpose. It is not meant to be used for buy or sell decision. We do not recommend any particular stocks. If particular stocks of such are mentioned, they are meant as demonstration of Amibroker as a powerful charting software and MACD. Amibroker can program to scan the stocks for buy and sell signals.
These are script generated signals. Not all scan results are shown here. The MACD signal should use with price action. Users must understand what MACD and price action are all about before using them. If necessary you should attend a course to learn more on Technical Analysis (TA) and Moving Average Convergence Divergence, MACD.
Once again, the website does not guarantee any results or investment return based on the information and instruction you have read here. It should be used as learning aids only and if you decide to trade real money, all trading decision should be your own.