September 25, 2017
One-day US Stock MACD Scan Results for 15 September 2017
Remember all setup can fail. This is true for all indicators. It is also true for MACD signals setup.
September 15, 2017 One-day US Stock MACD Signals
The Following are September 15, 2017 One-day US Stock MACD Scan Signals
The following are script generated signals using the Powerful AmiBroker AFL. AmiBroker is a powerful charting software. The results here are not meant to be used for buy or sell decisions. We do not vouch for their accuracy; depending of the author trading rules. They are meant to demonstrate the powerful Amibroker charting software functionality.
NOT all scan results are shown here.
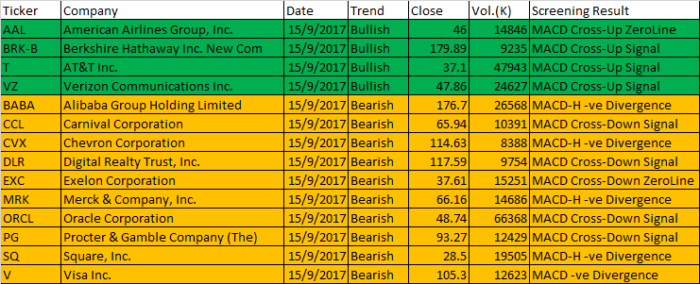
| Ticker | Company | Date | Trend | Close | Vol.(K) | Screening Result |
| AAL | American Airlines Group, Inc. | 15/9/2017 | Bullish | 46 | 14846 | MACD Cross-Up ZeroLine |
| BRK-B | Berkshire Hathaway Inc. New Com | 15/9/2017 | Bullish | 179.89 | 9235 | MACD Cross-Up Signal |
| T | AT&T Inc. | 15/9/2017 | Bullish | 37.1 | 47943 | MACD Cross-Up Signal |
| VZ | Verizon Communications Inc. | 15/9/2017 | Bullish | 47.86 | 24627 | MACD Cross-Up Signal |
| BABA | Alibaba Group Holding Limited | 15/9/2017 | Bearish | 176.7 | 26568 | MACD-H -ve Divergence |
| CCL | Carnival Corporation | 15/9/2017 | Bearish | 65.94 | 10391 | MACD Cross-Down Signal |
| CVX | Chevron Corporation | 15/9/2017 | Bearish | 114.63 | 8388 | MACD-H -ve Divergence |
| DLR | Digital Realty Trust, Inc. | 15/9/2017 | Bearish | 117.59 | 9754 | MACD Cross-Down Signal |
| EXC | Exelon Corporation | 15/9/2017 | Bearish | 37.61 | 15251 | MACD Cross-Down ZeroLine |
| MRK | Merck & Company, Inc. | 15/9/2017 | Bearish | 66.16 | 14686 | MACD-H -ve Divergence |
| ORCL | Oracle Corporation | 15/9/2017 | Bearish | 48.74 | 66368 | MACD Cross-Down Signal |
| PG | Procter & Gamble Company (The) | 15/9/2017 | Bearish | 93.27 | 12429 | MACD Cross-Down Signal |
| SQ | Square, Inc. | 15/9/2017 | Bearish | 28.5 | 19505 | MACD-H -ve Divergence |
| V | Visa Inc. | 15/9/2017 | Bearish | 105.3 | 12623 | MACD -ve Divergence |
Note:
Users must understand what MACD is all about before using the results.
Have fun!
Moses US Stock MACD Scan Signals
AmiBroker Academy.com
Disclaimer:
The above result is for illustration purpose. It is not meant to be used for buy or sell decision. We do not recommend any particular stocks. If particular stocks of such are mentioned, they are meant as demonstration of Amibroker as a powerful charting software and MACD. Amibroker can program to scan the stocks for buy and sell signals.
These are script generated signals. Not all scan results are shown here. The MACD signal should use with price action. Users must understand what MACD and price action are all about before using them. If necessary you should attend a course to learn more on Technical Analysis (TA) and Moving Average Convergence Divergence, MACD.
Once again, the website does not guarantee any results or investment return based on the information and instruction you have read here. It should be used as learning aids only and if you decide to trade real money, all trading decision should be your own.