July 6, 2018
Thanks for visiting the site.
Last week we notice most of the stock market indexes continue to be bearish, except a few. In our last analysis, we used boxes to show you where the strong support were. We also shown the breakout from the support.
^STI ST Index Charting and Stochastic
We see the market will likely to test the 3200 level before it slow down. 3200 level could be the turning point for the ST Index. Hold your horse.
Manage your risk.
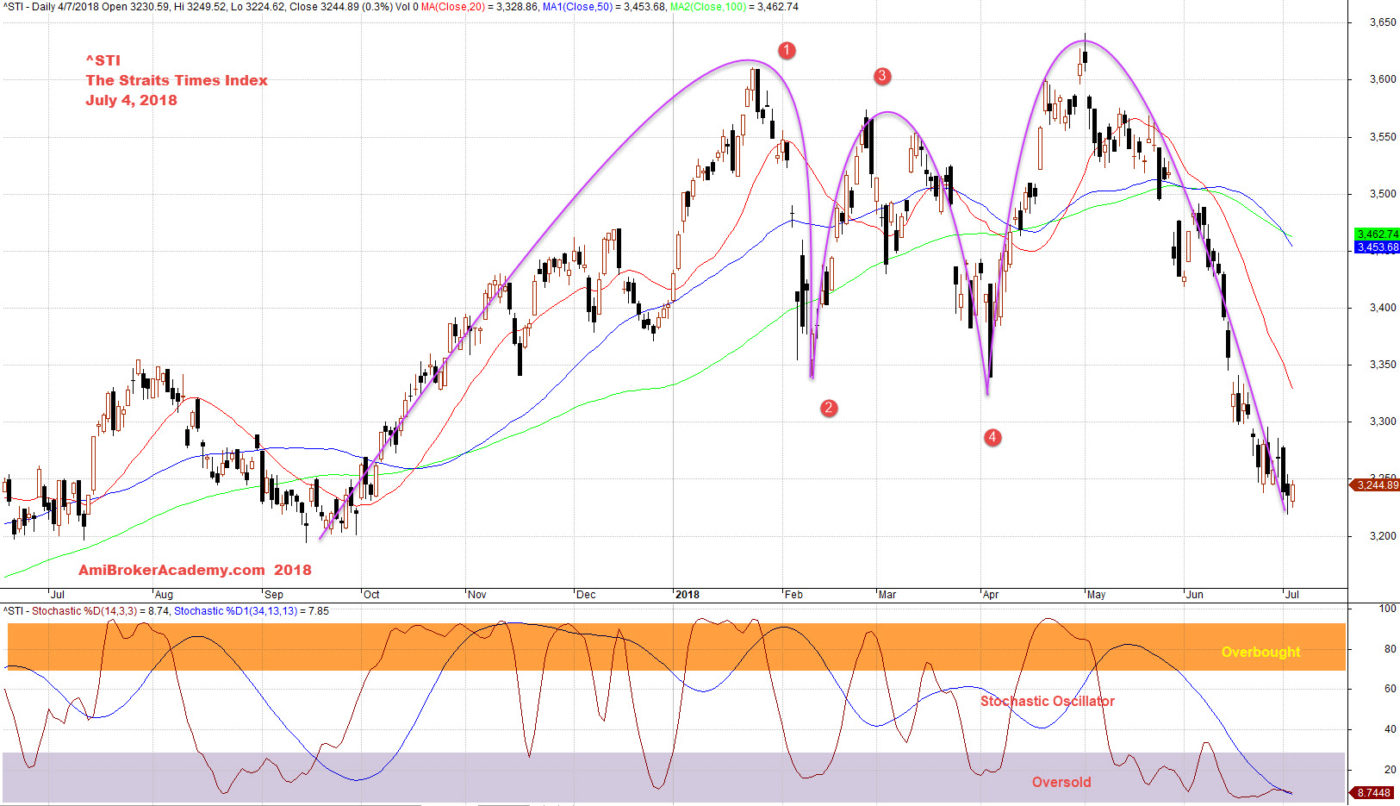
July 4, 2018 The Straits Times Index and Stochastic
You have to learn how to catch the falling knife.
Moses
AmiBrokerAcademy.com
Disclaimer
The above result is for illustration purpose. It is not meant to be used for buy or sell decision. We do not recommend any particular stocks. If particular stocks of such are mentioned, they are meant as demonstration of Amibroker as a powerful charting software and MACD. Amibroker can program to scan the stocks for buy and sell signals.
These are script generated signals. Not all scan results are shown here. The MACD signal should use with price action. Users must understand what MACD and price action are all about before using them. If necessary you should attend a course to learn more on Technical Analysis (TA) and Moving Average Convergence Divergence, MACD.
Once again, the website does not guarantee any results or investment return based on the information and instruction you have read here. It should be used as learning aids only and if you decide to trade real money, all trading decision should be your own.