6 July, 2018
Thanks for visiting the site.
Majority of stock indices continue to show bearish patterns!
Just in case you did not notice majority of stock indices continue is show bearish patterns in past week! But this does not mean all stock will be bearish. See the example like Apple Inc stock continue to form higher high and higher low. Trade with eyes open.
U.S. Stock Chart Analysis
^IXIC NASDAQ Composite Index Stock Charting
Study the stock chart of NASDAQ Composite Index, you see the price action continue to form higher high and higher low. Picture worth a thousand words, see chart the price continue to be bullish and not like other stock indexes.
You can add an indicator like stochastic oscillator to overbought or oversold. Currently stochastic is oversold.
If you will study the moving averages, you will notice the price action has crossed down 20 period MA. 20 MA begins to slop down. The price action is supported by 50 MA. 20, 50 MA are above 100 MA. The 100 MA is slopping up. Generally the trend is bullish.
Trade with eyes open and manage your risk.
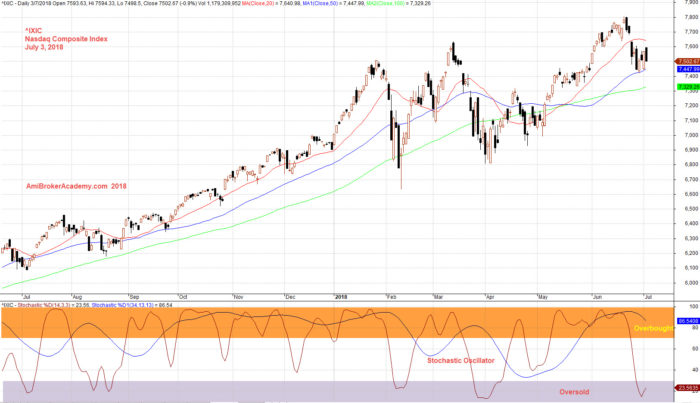
July 3, 2018 Nasdaq Composite Index and Stochastic Oscillator
^IXIC NASDAQ Composite Index Stock Charting and MACD
See divergence, picture worth a thousand words, see chart.
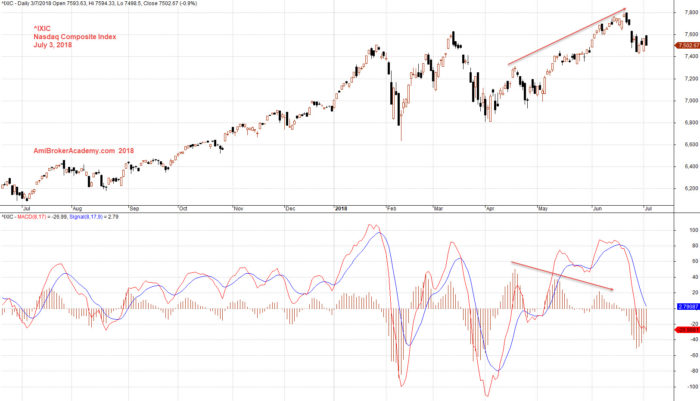
July 3, 2018 Nasdaq Composite Index and MACD
Moses US Stock Chart Analysis
AmiBrokerAcademy.com
Disclaimer
The above result is for illustration purpose. It is not meant to be used for buy or sell decision. We do not recommend any particular stocks. If particular stocks of such are mentioned, they are meant as demonstration of Amibroker as a powerful charting software and MACD. Amibroker can program to scan the stocks for buy and sell signals.
These are script generated signals. Not all scan results are shown here. The MACD signal should use with price action. Users must understand what MACD and price action are all about before using them. If necessary you should attend a course to learn more on Technical Analysis (TA) and Moving Average Convergence Divergence, MACD.
Once again, the website does not guarantee any results or investment return based on the information and instruction you have read here. It should be used as learning aids only and if you decide to trade real money, all trading decision should be your own.