September 1, 2017
August 31, 2017 Shandong Luxin H and MACD Singal with Trendline
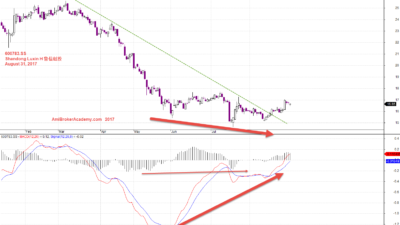
600783.SS 鲁信创投 Shandong Luxin H and MACD Signals
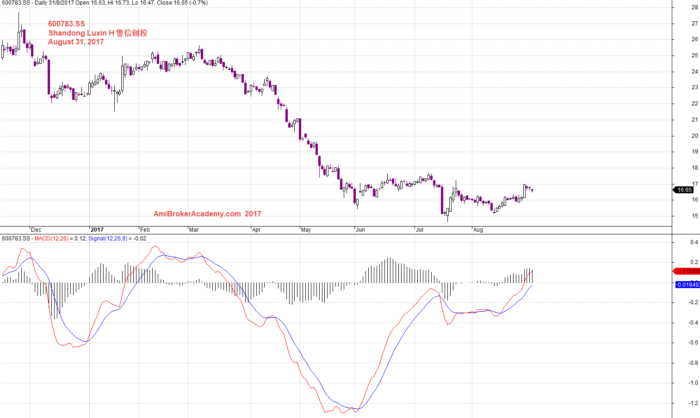
Picture worth a thousand words. See chart for more. Picture worth a thousand words. Share price is moving in zigzag. The share price reach the bottom again; retest the low. If you see carefully, you probably see a double U. Is this going to be a sign of strong support? Do not know.
You see, you find the share price continues to go lower; forming lower low. But the MACD signal begin to form higher low. Is this a signal to say the trend is ending and about to reverse. Will see.
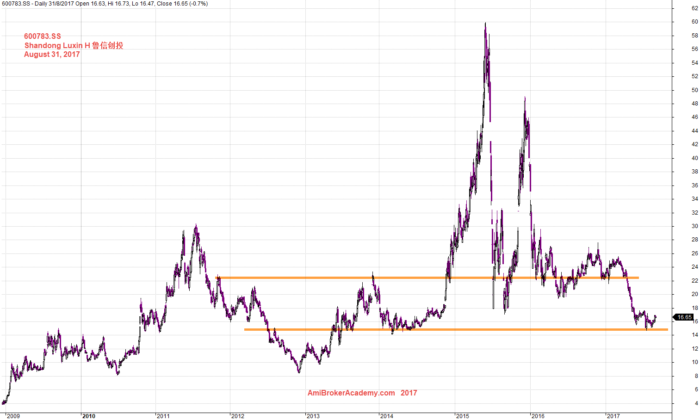
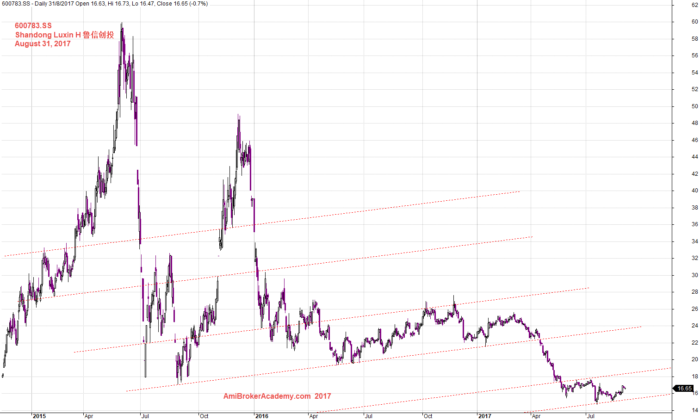
600783.SS 鲁信创投 Shandong Luxin H Stock Price Since 2009
Still uptrend. If you have hold the price since 2009, you still make lah (Singlish).
August 31, 2017 Shandong Luxin H and Support Resistance
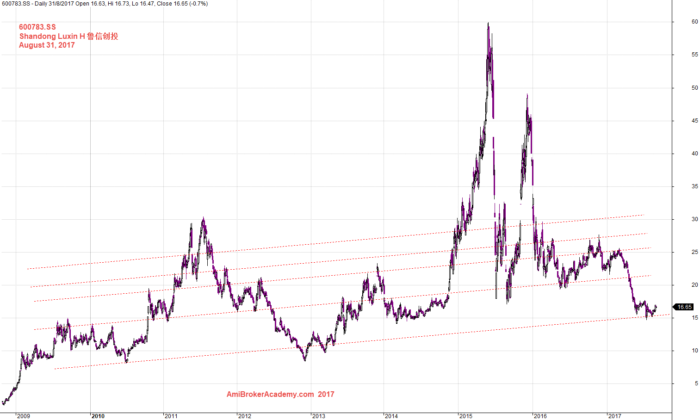
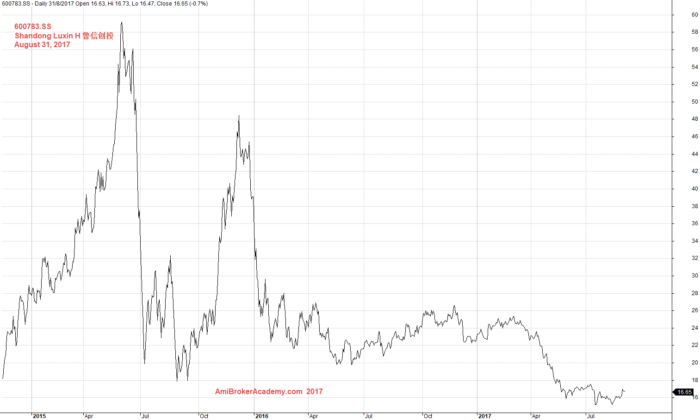
600783.SS 鲁信创投 Shandong Luxin H Channel
See channel slopping up, bullish trend. As said, if you hold the stock since 2009, you still safe, make money.
August 31, 2017 Shandong Luxin H and Channel
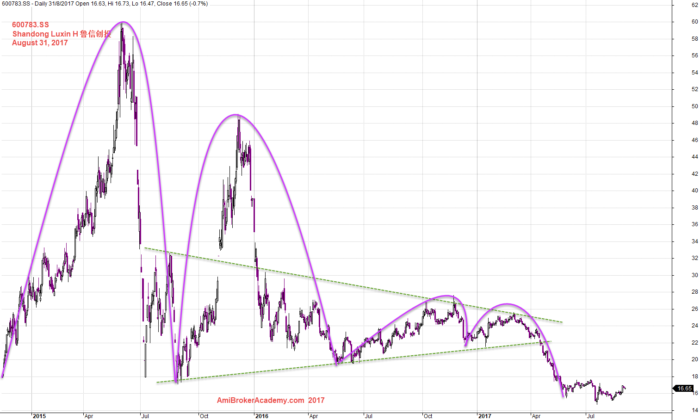
600783.SS 鲁信创投 Shandong Luxin H Triangle
August 31, 2017 Shandong Luxin and Price Action Bouncing
600783.SS 鲁信创投 Shandong Luxin H in Channel
Same chart, but with channel added. What is the different?
August 31, 2017 Shandong Luxin and Channel Zoom In
600783.SS 鲁信创投 Shandong Luxin H Line Chart
Turn to line chart for a better view on the wave count.
August 31, 2017 Shandong Luxin and Line Chart
600783.SS 鲁信创投 Shandong Luxin H Support Resistance
Zoom in, to see a different support resistance.
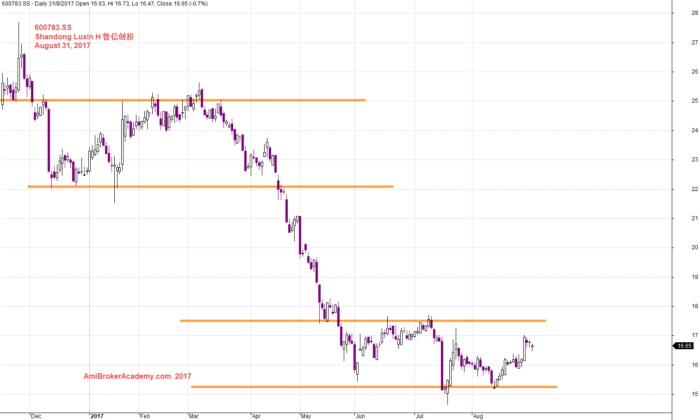
August 31, 2017 Shandong Luxin H and Support Resistance
600783.SS 鲁信创投 Shandong Luxin H MACD
To make the analysis complete, let’s also see the MACD indicator again. Have fun!
August 31, 2017 Shandong Luxin and MACD
Thanks for visit the site here. You could also find free MACD scan here in this site too.
Moses
AmiBrokerAcademy.com
Disclaimer
The above result is for illustration purpose. It is not meant to be used for buy or sell decision. We do not recommend any particular stocks. If particular stocks of such are mentioned, they are meant as demonstration of Amibroker as a powerful charting software and MACD. Amibroker can program to scan the stocks for buy and sell signals.
These are script generated signals. Not all scan results are shown here. The MACD signal should use with price action. Users must understand what MACD and price action are all about before using them. If necessary you should attend a course to learn more on Technical Analysis (TA) and Moving Average Convergence Divergence, MACD.
Once again, the website does not guarantee any results or investment return based on the information and instruction you have read here. It should be used as learning aids only and if you decide to trade real money, all trading decision should be your own.