August 31, 2017
MACD Indicator
We like MACD. MACD is a leading indicator, the trend change.
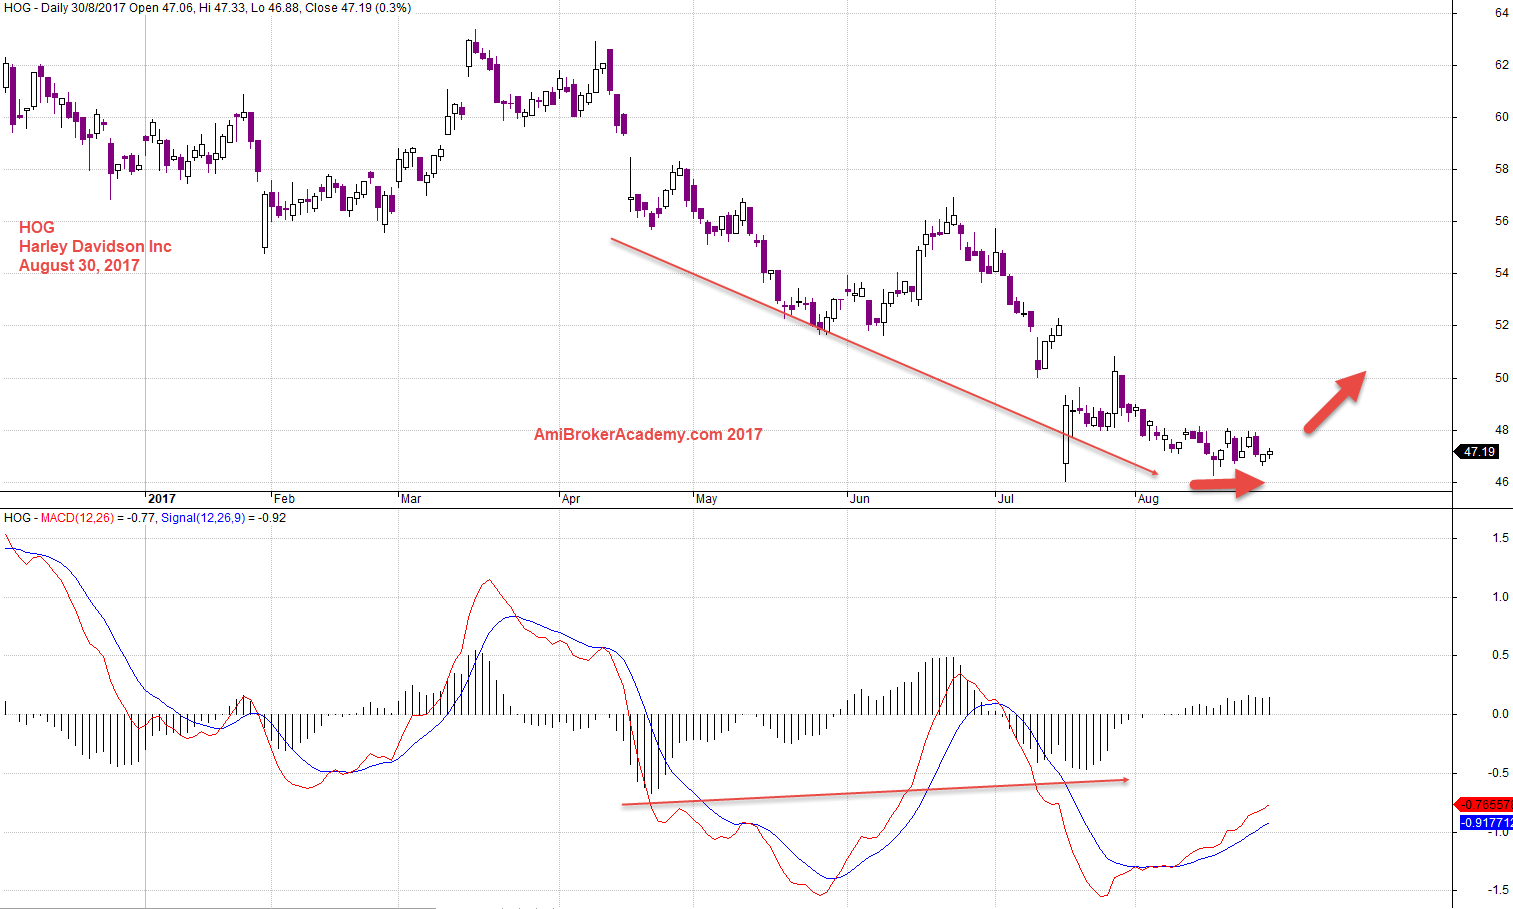
HOG Harley Davidson and MACD Signal
Picture worth a thousand words. We see the share price continues to form lower low, and the MACD Histogram just continue to form higher low. Can the $47 a turning point for Harley? Will see.
August 30, 2017 Harley Davidson and MACD
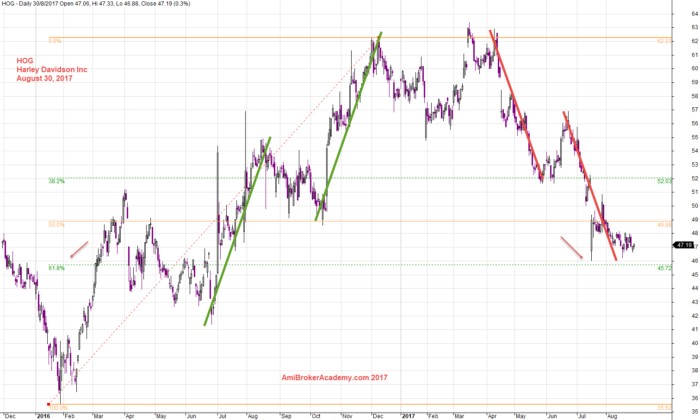
HOG Harley Davidson and Fibonacci Retracement
Picture worth a thousand words. $47 is a good level. We see the $47 is the 61% of the Fibonacci 61% retracement. Watch the share price.
August 30, 2017 Harley Davidson and Fibonacci Retracement
Thanks for visit the site here. You could also find free MACD scan here in this site too.
Moses
AmiBrokerAcademy.com
Disclaimer
The above result is for illustration purpose. It is not meant to be used for buy or sell decision. We do not recommend any particular stocks. If particular stocks of such are mentioned, they are meant as demonstration of Amibroker as a powerful charting software and MACD. Amibroker can program to scan the stocks for buy and sell signals.
These are script generated signals. Not all scan results are shown here. The MACD signal should use with price action. Users must understand what MACD and price action are all about before using them. If necessary you should attend a course to learn more on Technical Analysis (TA) and Moving Average Convergence Divergence, MACD.
Once again, the website does not guarantee any results or investment return based on the information and instruction you have read here. It should be used as learning aids only and if you decide to trade real money, all trading decision should be your own.