July 1, 2017
Second Look at ST Index
After wee see the ten years Straits Times Index, can we see the chart from a different view.
The Straits Times Index and Major Support Resistance
Picture worth a thousand words.
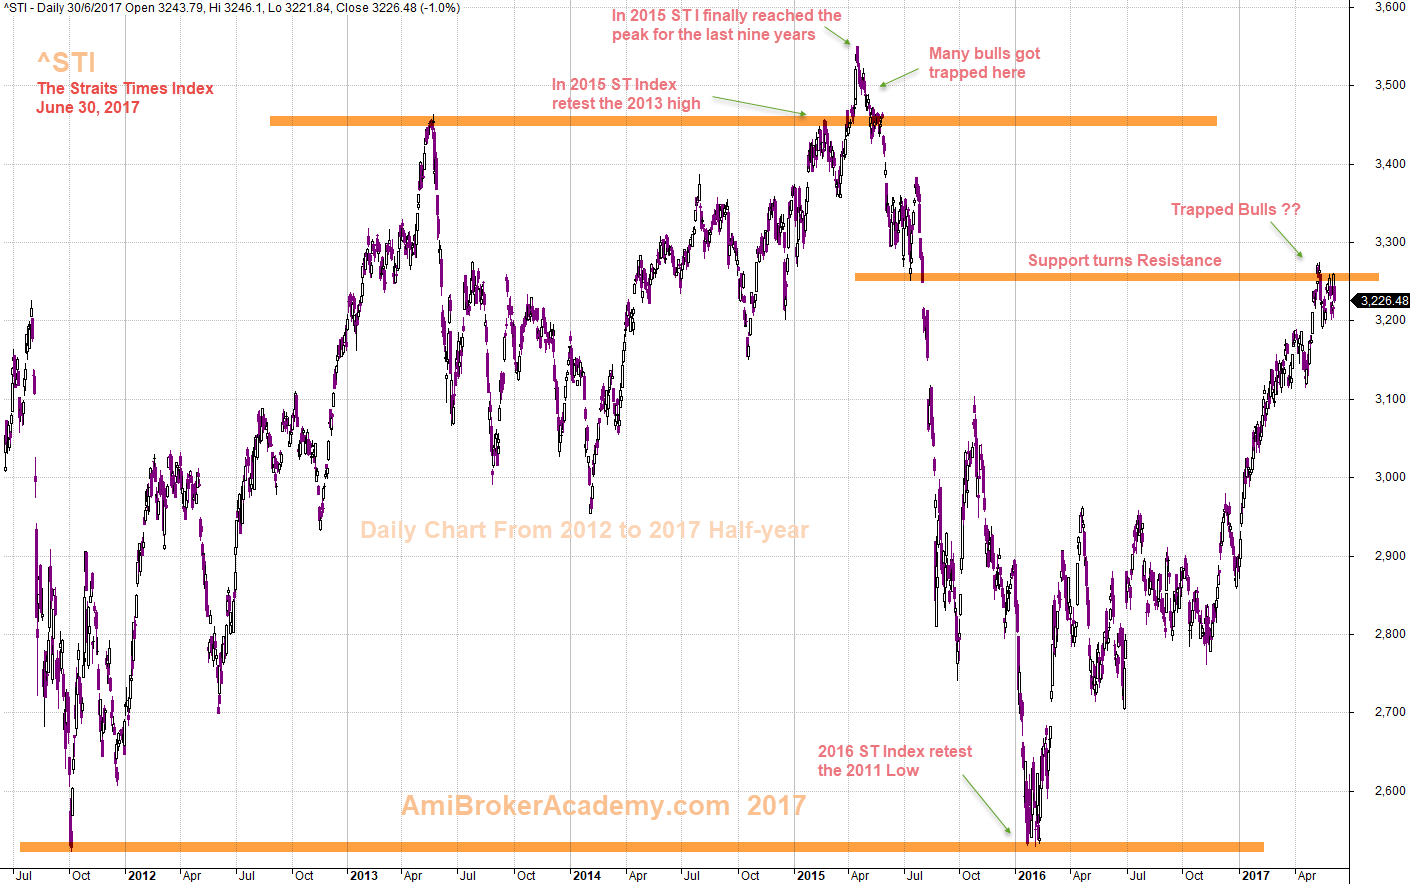
When you analyse ten years chart, see early posting for more. The channel slopping from the bottom left to the top right, the trend is still up. When we zoom in, we can not see such a amazing uptrend. But, let analyse the chart base on what we see here.
We see the low in 2011, this is after the 2008 Great Recession. The price action finally reach the high in 2013, and we should understand in order for the price action to continue it will pullback. This pullback retest the final higher low of the bullish trend. The bullish trend resume again. In the trend here you can see those professional trade retracement. They will enjoy the pullback and resume.
We said, the price action fail the retest the high a few times, in 2010, 2013, 2015. Of course we can not see the 2010 fail. The price action begin to drift south in 2015 until beginning of 2016, the low is rest on 2011 low. What if the price action break through the support, the next level will be the 2009 low. Check this out in the ten years chart.
In the chart analysis here, you can spot many great resistance and great support level. Make your plan and trade the next six months of 2017.
June 30, 2017 The Straits Times Index and Key Support Resistance
Hope you enjoy the analysis here, we do it different from others.
Moses Stock Analysis
AmiBrokerAcademy.com
Disclaimer
The above result is for illustration purpose. It is not meant to be used for buy or sell decision. We do not recommend any particular stocks. If particular stocks of such are mentioned, they are meant as demonstration of Amibroker as a powerful charting software and MACD. Amibroker can program to scan the stocks for buy and sell signals.
These are script generated signals. Not all scan results are shown here. The MACD signal should use with price action. Users must understand what MACD and price action are all about before using them. If necessary you should attend a course to learn more on Technical Analysis (TA) and Moving Average Convergence Divergence, MACD.
Once again, the website does not guarantee any results or investment return based on the information and instruction you have read here. It should be used as learning aids only and if you decide to trade real money, all trading decision should be your own.