July 1, 2017
Just for your information, …
Many of the analysis the story does not just end there, we just want to bring to your attention. We did a analysis on ST Index, also on the Monthly chart. See the link and the chart attached.
See link,
Straits Times Index Monthly Chart | Moses Stock Analysis
The chart we posted
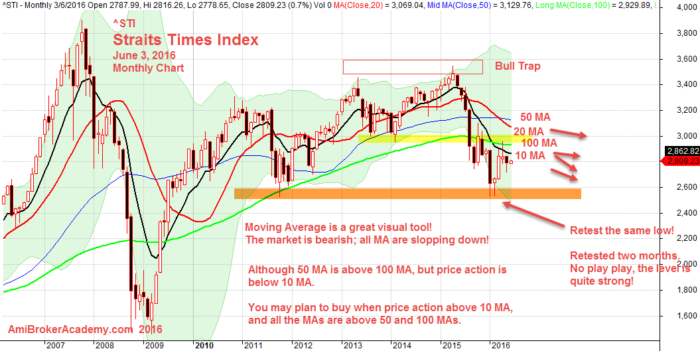
June 3, 2016 Straits Times Index Monthly Chart
Compare the chart we did a few posts back,
See the yellow line drew in June 3, 2016 analysis and the orange line draw in June 30, 2017 analysis. They are the same support. So, you see the support turns resistance. The resistance were test and retest many time and finally breakout. …
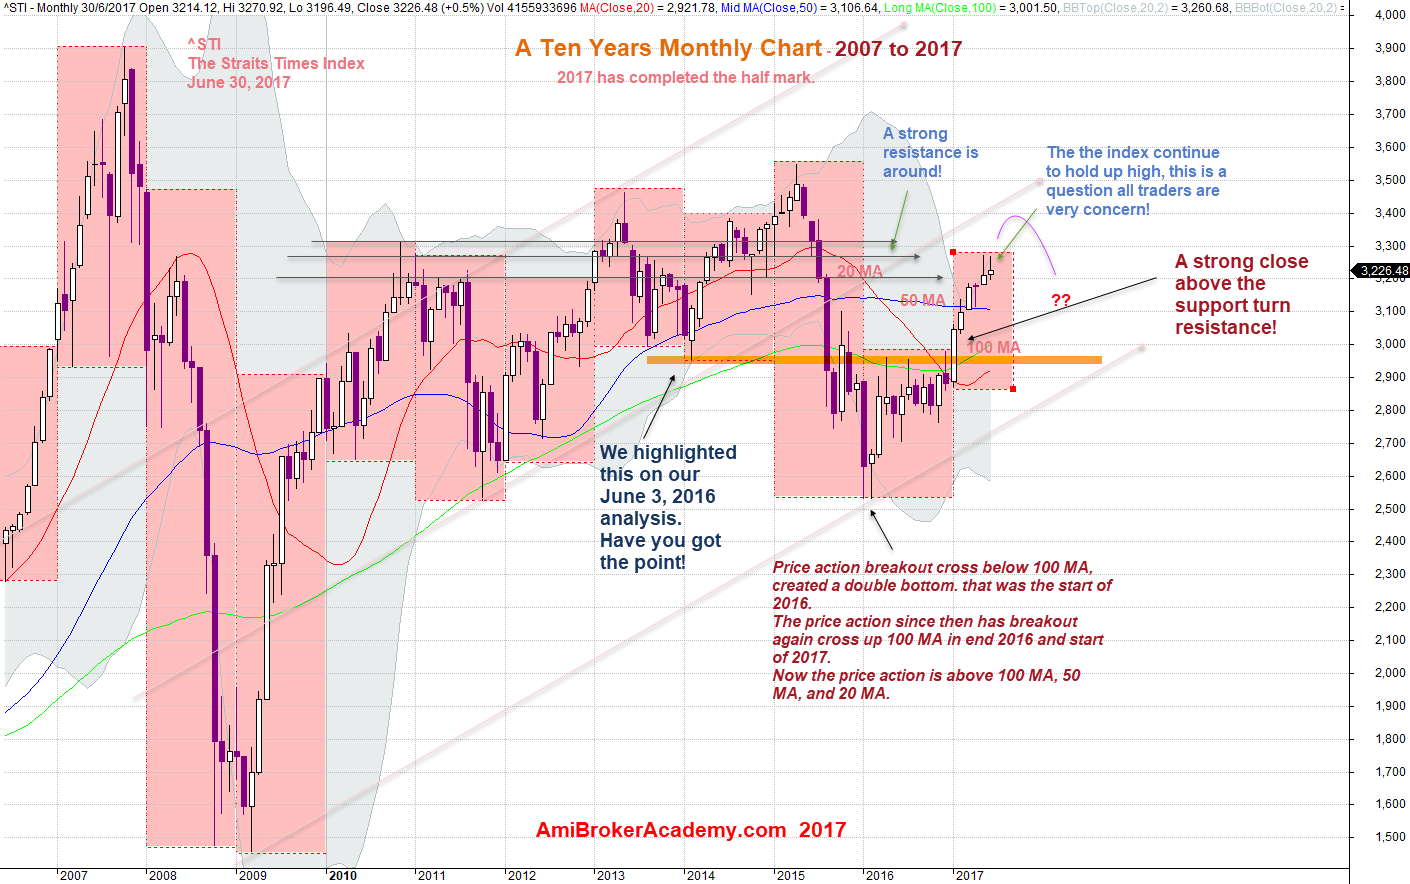
June 30, 2017 The Straits Times Index and the key level drew a year back (june 3)
Hope you enjoy the analysis here, we do it different from others.
Moses Stock Analysis
AmiBrokerAcademy.com
Disclaimer
The above result is for illustration purpose. It is not meant to be used for buy or sell decision. We do not recommend any particular stocks. If particular stocks of such are mentioned, they are meant as demonstration of Amibroker as a powerful charting software and MACD. Amibroker can program to scan the stocks for buy and sell signals.
These are script generated signals. Not all scan results are shown here. The MACD signal should use with price action. Users must understand what MACD and price action are all about before using them. If necessary you should attend a course to learn more on Technical Analysis (TA) and Moving Average Convergence Divergence, MACD.
Once again, the website does not guarantee any results or investment return based on the information and instruction you have read here. It should be used as learning aids only and if you decide to trade real money, all trading decision should be your own.