May 10, 2017
It is time for you to change your trading style. Do not just listen to your stock broker suggestion. Think, Think think (things) got more things.
Unless your broker is a technical analysis trainer or fundamental analyst, otherwise they also hear the rumors from others.
ST Index has brokout 3200 Points but Why S68 Is Testing Its Three Months Low?
Picture worth a thousand words. See the chart below, the Singapore Exchange price action is testing its three months low. Can the support hold the fall? The next support is just only a few step below.
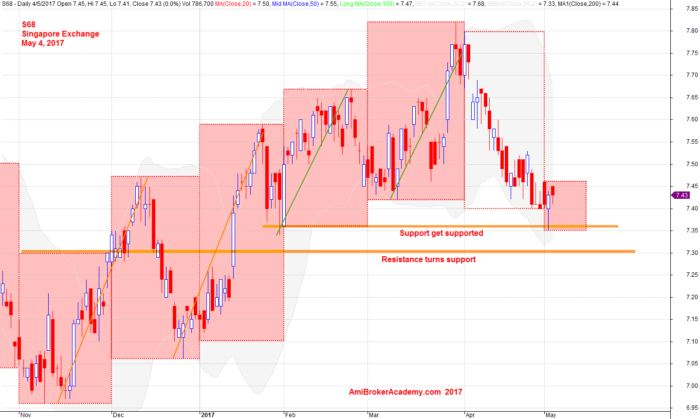
May 4, 2017 Singapore Exchange and Support Resistance
S68 Singapore Exchange and ABCD Chart Pattern and MACD Indicator
Picture worth a thousand words. We can easily sport many ABCD chart pattern. With the MACD indicator, we spotted divergence, so we might be alert to a possible trend changing.
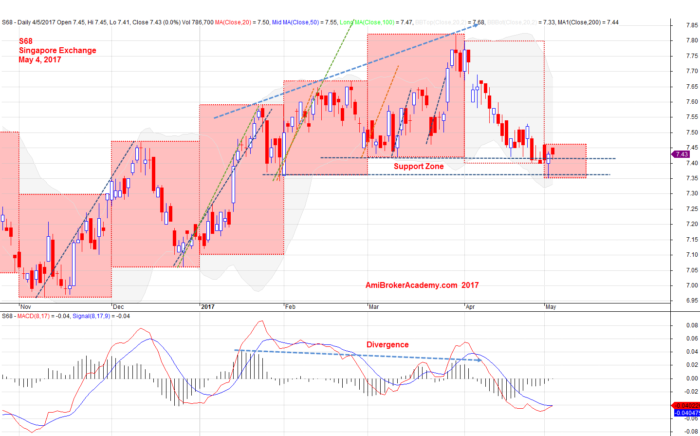
May 4, 2017 Singapore Exchange and MACD Indicator and Divergence
S68 Singapore Exchange and Moving Averages
Moving Average is a great visual aid to spot trend.
Besides that 34 EMA is a interesting setting, 34 is a Fibonacci sequence number see below.

Fibonacci Sequence
To know bullish or bearing trend, we can see the MA direction. When MA slopping up from bottom left to top right, it is easily recognize that it is a bullish trend.
When the price action bouncing off and above the MA, you are quite sure it is bullish. But this is only trend direction, it is not entry. To reduce your risk, it is better to buy support and sell resistance. So, even it is bullish, wait for the price to retrace back to support before you enter. And again, when you see the confirmation such as bullish candlestick at or near support before entry for buy. So, do not think trading is simple. It has number of thinking process before your entry.
Picture worth a thousand words, you see the price hit the peak and fail. The price action cross below MA. MA has changed from support to become resistance.
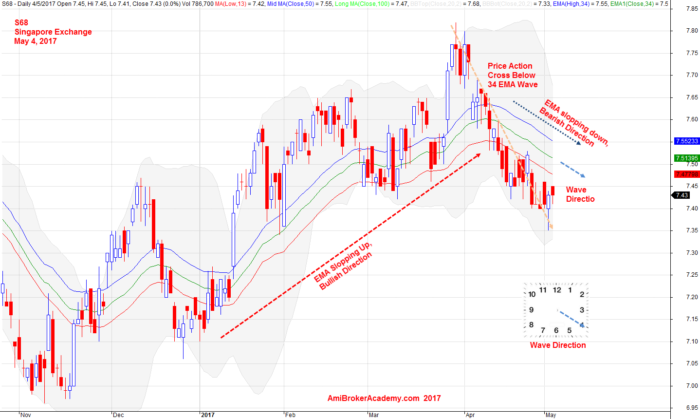
May 4, 2017 Singapore Exchange and EMA Wave Direction
Moses Stock Analysis
AmiBrokerAcademy.com
Disclaimer
The above result is for illustration purpose. It is not meant to be used for buy or sell decision. We do not recommend any particular stocks. If particular stocks of such are mentioned, they are meant as demonstration of Amibroker as a powerful charting software and MACD. Amibroker can program to scan the stocks for buy and sell signals.
These are script generated signals. Not all scan results are shown here. The MACD signal should use with price action. Users must understand what MACD and price action are all about before using them. If necessary you should attend a course to learn more on Technical Analysis (TA) and Moving Average Convergence Divergence, MACD.
Once again, the website does not guarantee any results or investment return based on the information and instruction you have read here. It should be used as learning aids only and if you decide to trade real money, all trading decision should be your own.