May 10, 2017
In my pc folder, you can find many charts. Many of the charts that have never get posted here. The following is just one of those. It is just too many. …
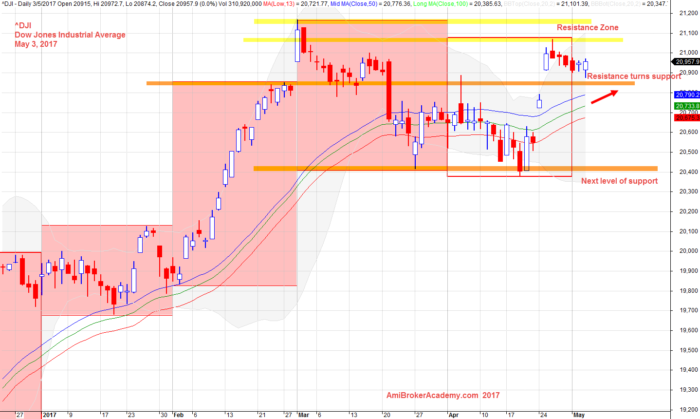
Dow Jones Industrial Average ^DJI Charting Support Resistance
See chart, you can easily find DJI try to retest the last high.
Moving Average is a great visual aid. DJI has been bouncing off the MA band. MA has been slopping from bottom left to top righ; bullish trend. But starting in March DJI start to retrace below the MA bands, the MA act as resistance. So, the market starting to change direction. Will only until the direction change otherwise, it is just the start of the market feel the price are just too high.
Put in all the support and resistance. No right No wrong, every trader draw their support resistance base on their understanding and experience. Here, to be consistence we reference to the month high and low.
So, we can see the price now drew near the support; the resistance turns support.
May 3, 2017 Dow Jones Industrial Average and Support Resistance
Dow Jones Industrial Average ^DJI Charting and High Low Trending
DJI try to retest the Feb high. After March 1, DJI starts to drift south.
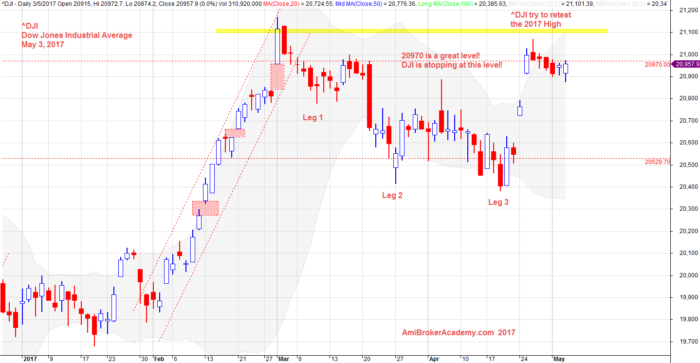
May 3, 2017 Dow Jones Industrial Average and High Low Trend
The analysis here is intended to be a tutorial only. We look at the chart from different views. We mainly study the popular stocks in US market and Singapore. Hope you can learn something. There is no right no wrong.
Moses Stock Analysis
AmiBrokerAcademy.com
Disclaimer
The above result is for illustration purpose. It is not meant to be used for buy or sell decision. We do not recommend any particular stocks. If particular stocks of such are mentioned, they are meant as demonstration of Amibroker as a powerful charting software and MACD. Amibroker can program to scan the stocks for buy and sell signals.
These are script generated signals. Not all scan results are shown here. The MACD signal should use with price action. Users must understand what MACD and price action are all about before using them. If necessary you should attend a course to learn more on Technical Analysis (TA) and Moving Average Convergence Divergence, MACD.
Once again, the website does not guarantee any results or investment return based on the information and instruction you have read here. It should be used as learning aids only and if you decide to trade real money, all trading decision should be your own.