11 January 2019
Thanks for visiting the site.
Hong Kong Stock Analysis
香港股市分析
Hong Kong Stock 香港股票
^HSI Hang Seng Index Charting
Trade with your eyes open. Manage your trade.
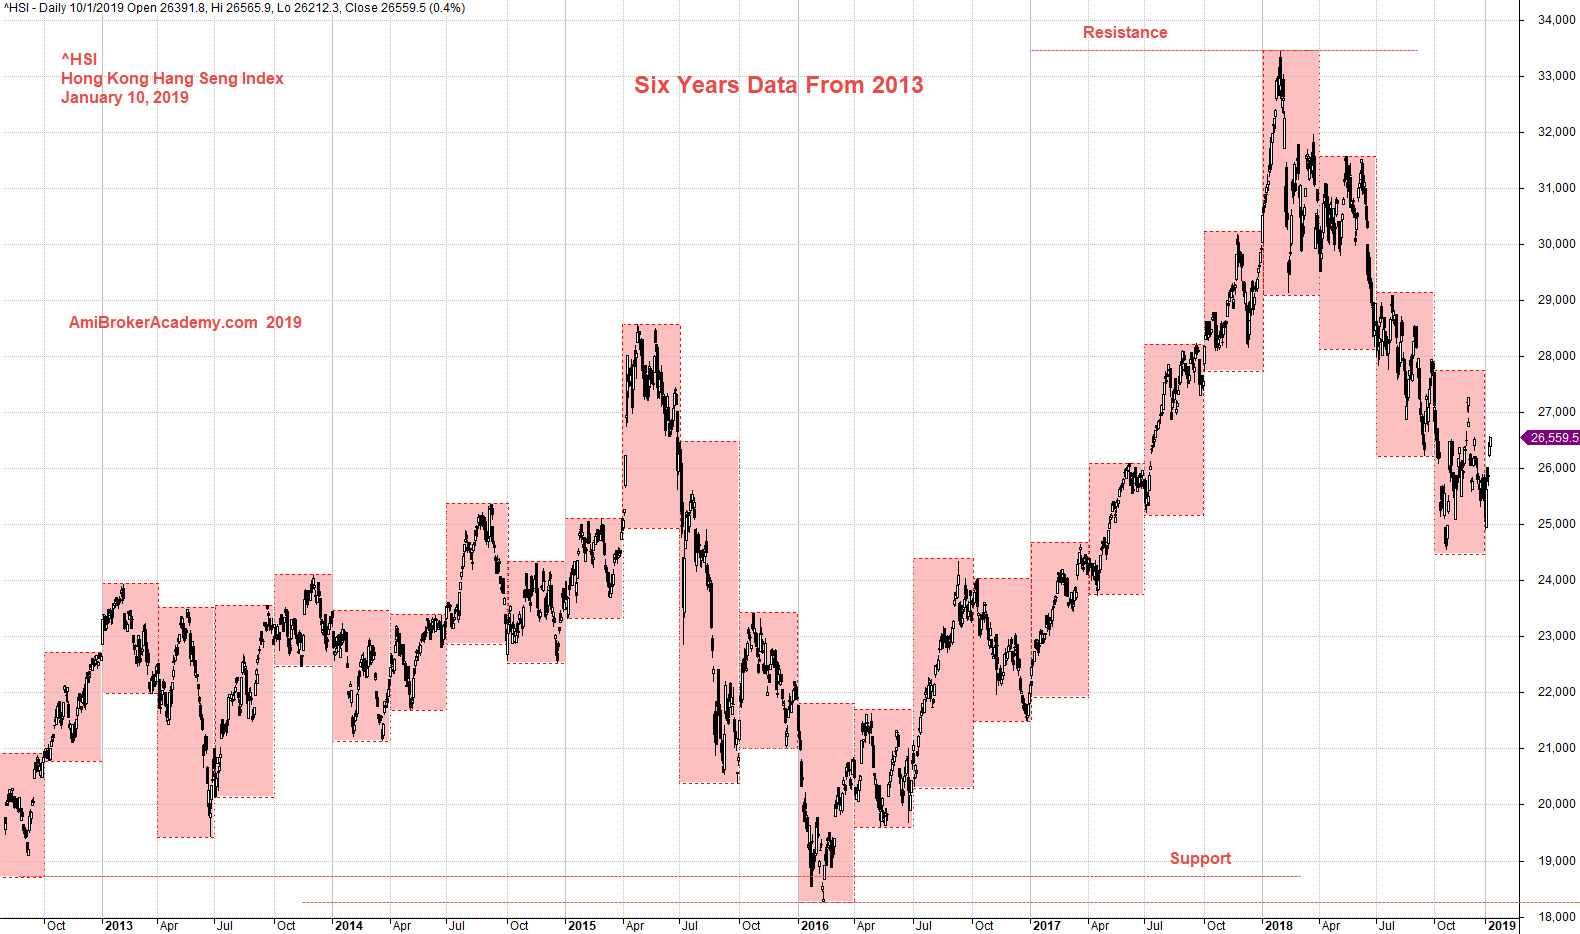
Study Hang Seng Index chart, you see price action touch the peak in 2018, resistance and fail. See chart, the price action moves in a narrow channel. The price action trapped within ;support and resistance. Will the price action retest the support this year. Will see.
See chart, picture worth a thousand words.
Trade with eyes open.
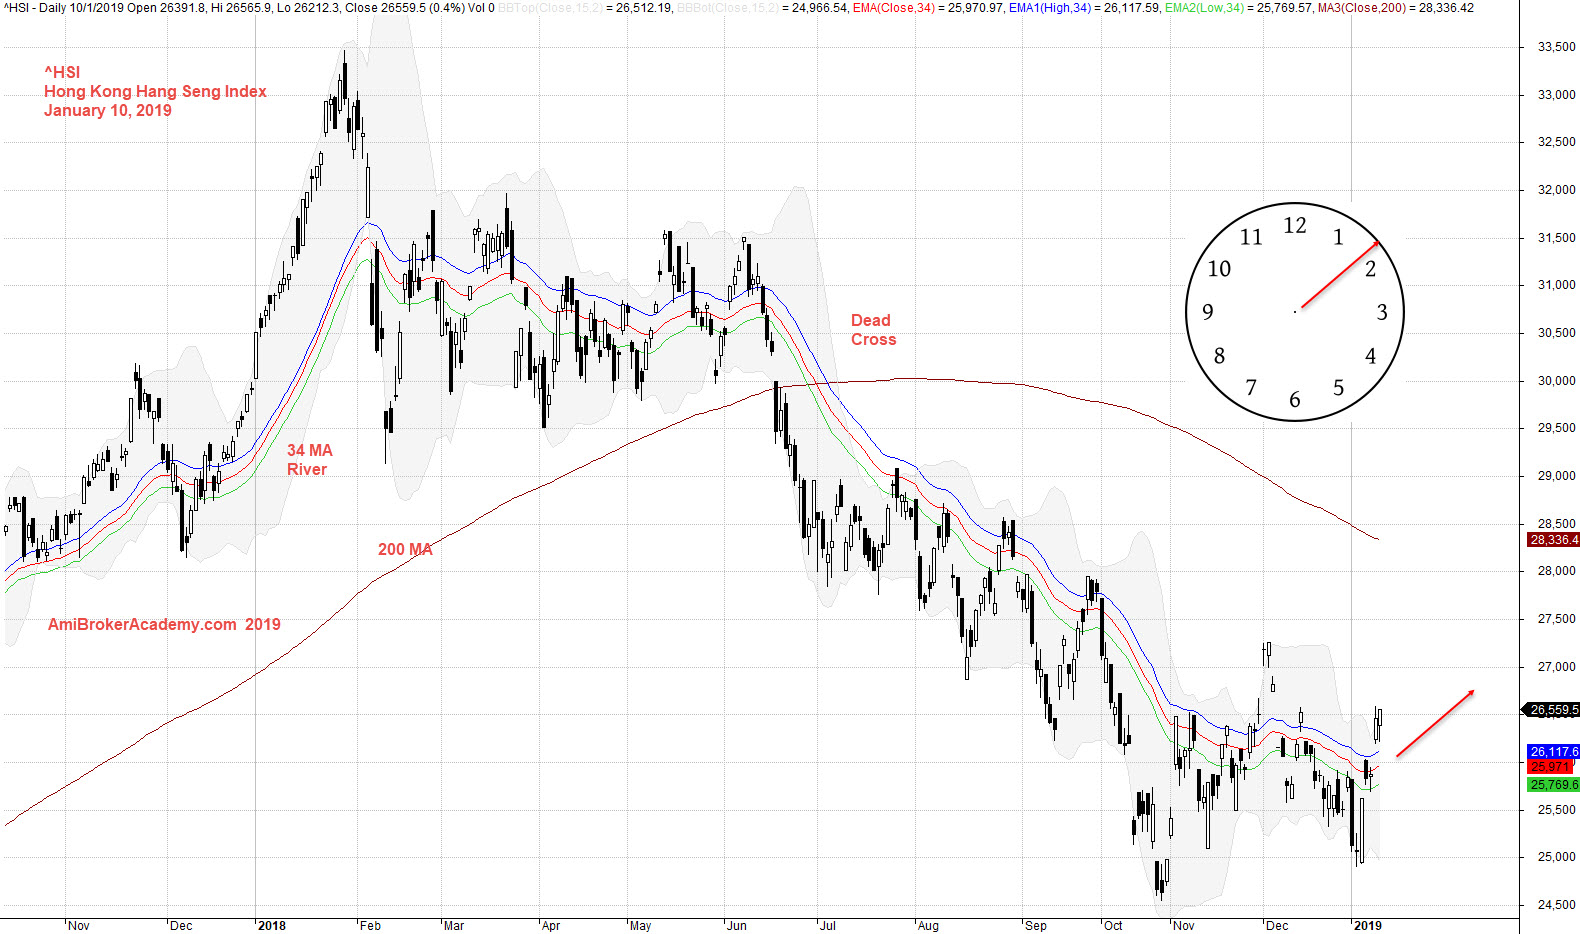
Study Hang Seng Index using moving average, add 34 period high low and close MA. Price action close below MA and stay below MA, bearish bias.
Trade with eyes open.
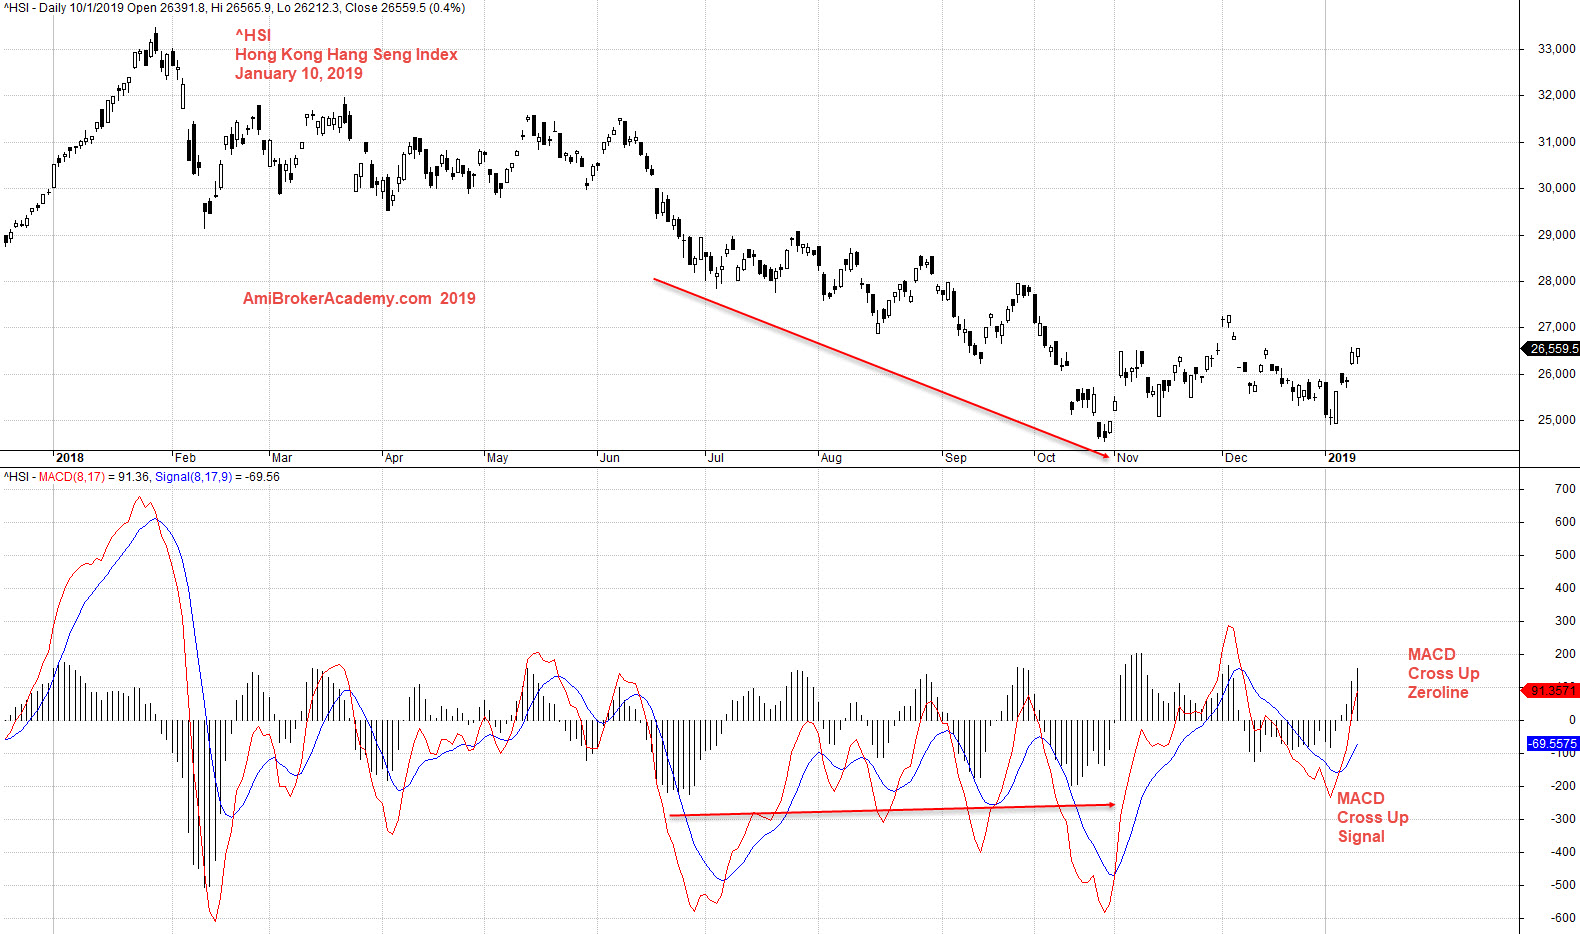
Study Hang Seng Index with MACD indicator. See chart.
Moses
AmiBrokerAcademy.com
Disclaimer
The above result is for illustration purpose. It is not meant to be used for buy or sell decision. We do not recommend any particular stocks. If particular stocks of such are mentioned, they are meant as demonstration of Amibroker as a powerful charting software and MACD. Amibroker can program to scan the stocks for buy and sell signals.
These are script generated signals. Not all scan results are shown here. The MACD signal should use with price action. Users must understand what MACD and price action are all about before using them. If necessary you should attend a course to learn more on Technical Analysis (TA) and Moving Average Convergence Divergence, MACD.
Once again, the website does not guarantee any results or investment return based on the information and instruction you have read here. It should be used as learning aids only and if you decide to trade real money, all trading decision should be your own.