11 January 2019
Thanks for visiting the site.
Shanghai Stock Analysis
600000.SS 浦发银行 Shanghai Pudong Development Bank Co Charting
Trade with your eyes open. Manage your trade.
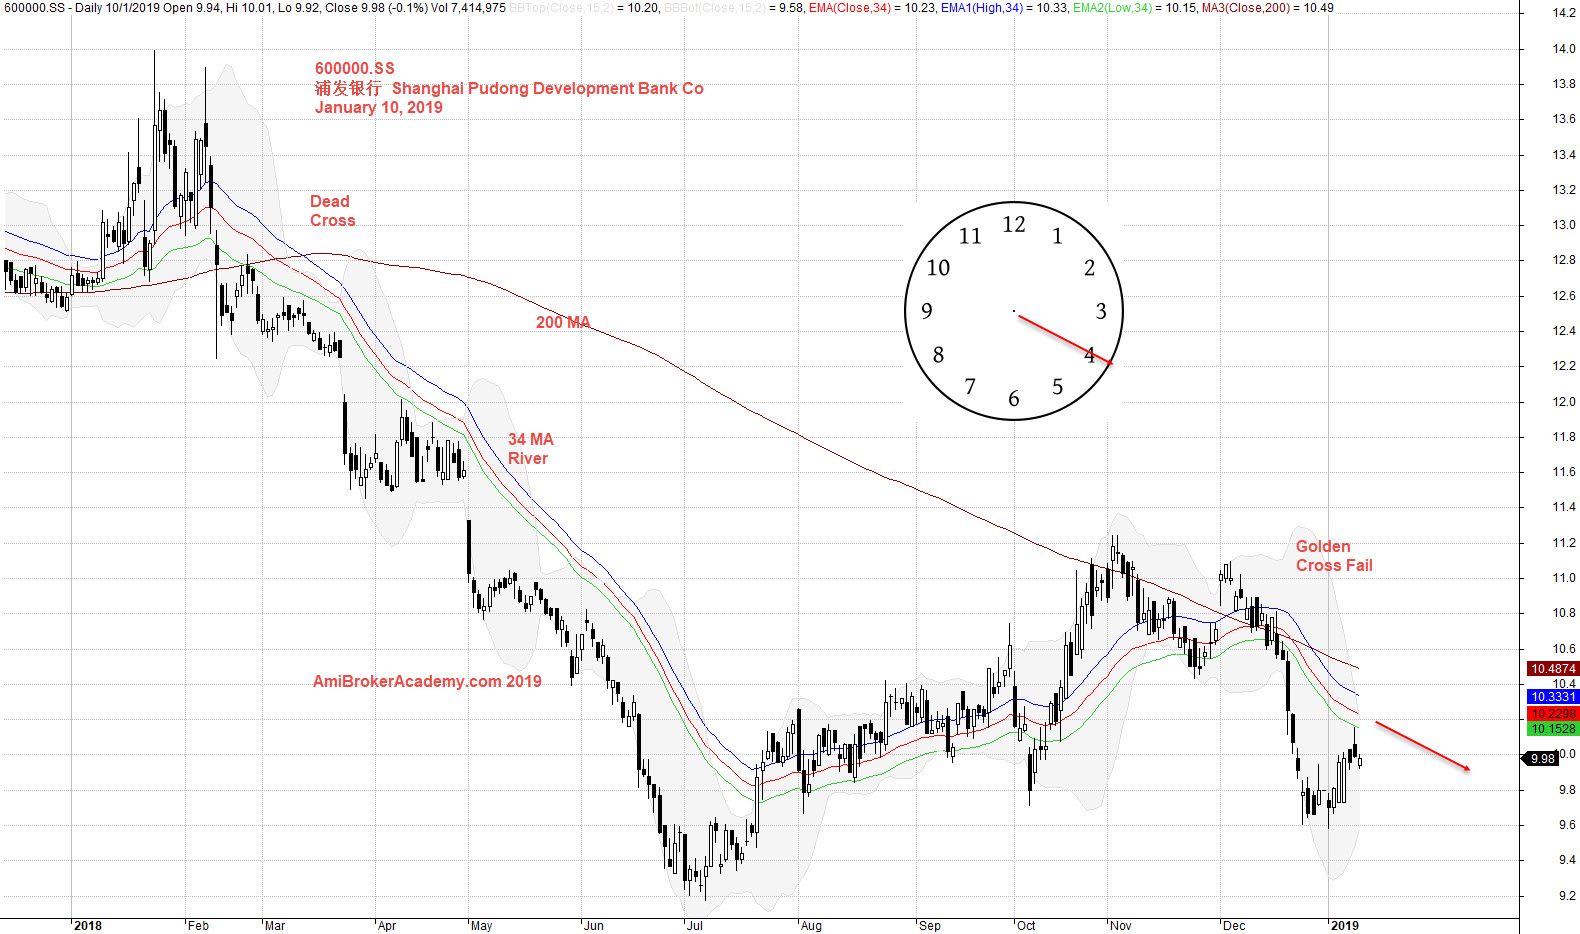
Study 浦发银行 Shanghai Pudong Development Bank Co stock chart using month high low to understand the stock trend. From chart you see the price action test the high a few times before decline.
See chart, picture worth a thousand words.
Price action moves in a zigzag manner.
Trade with eyes open.

Study Pudong Development Bank stock chart using Moving Average. Moving Average provides a visual effect for trend. See chart.
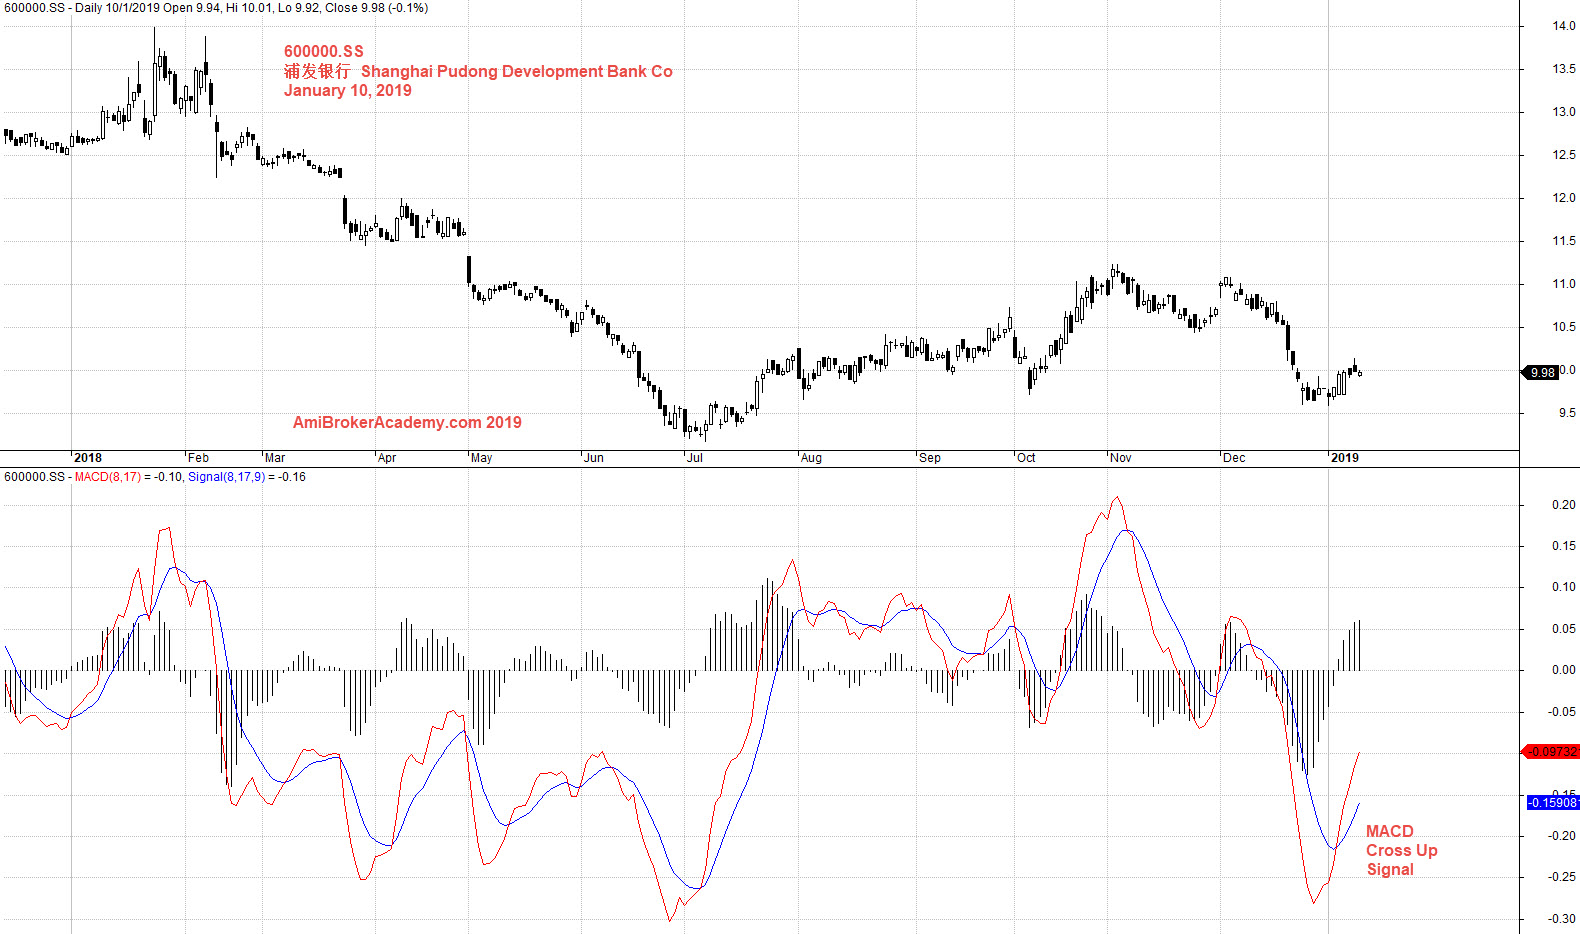
Study Pudong Development Bank stock chart using MACD indicator. Trade with eyes open.
Moses
AmiBrokerAcademy.com
Disclaimer
The above result is for illustration purpose. It is not meant to be used for buy or sell decision. We do not recommend any particular stocks. If particular stocks of such are mentioned, they are meant as demonstration of Amibroker as a powerful charting software and MACD. Amibroker can program to scan the stocks for buy and sell signals.
These are script generated signals. Not all scan results are shown here. The MACD signal should use with price action. Users must understand what MACD and price action are all about before using them. If necessary you should attend a course to learn more on Technical Analysis (TA) and Moving Average Convergence Divergence, MACD.
Once again, the website does not guarantee any results or investment return based on the information and instruction you have read here. It should be used as learning aids only and if you decide to trade real money, all trading decision should be your own.