29 January 2019
Thanks for visiting the site.
Moses Stock Analysis
0992.HK Lenovo Group 联想集团 Charting
Trade with your eyes open. Manage your trade.
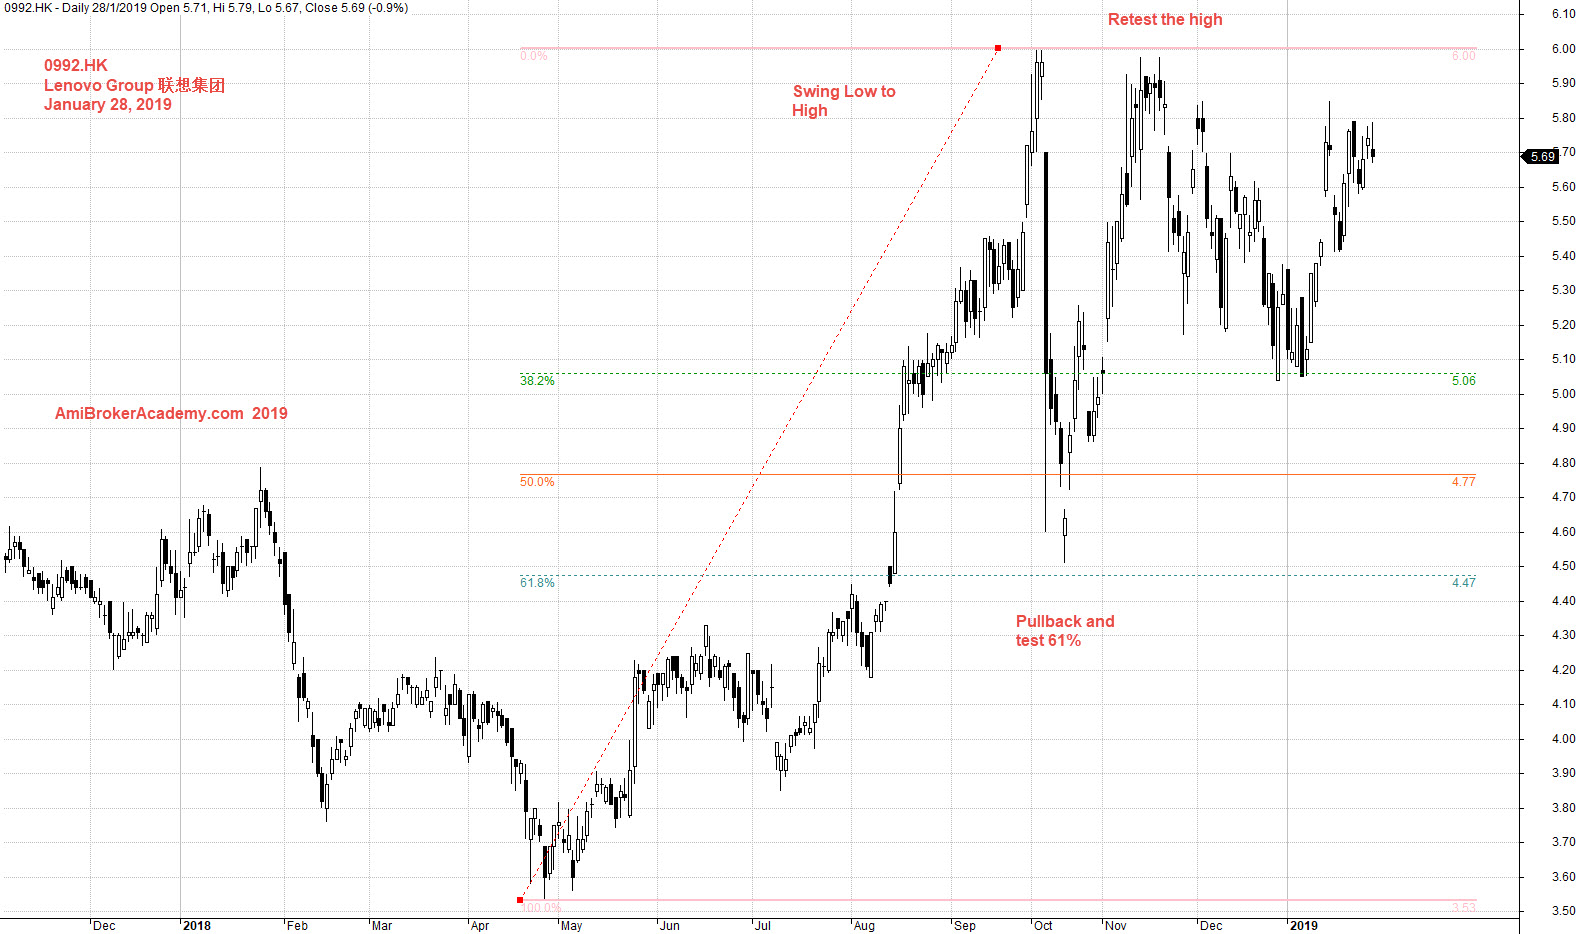
Study Lenovo Group 联想集团 stock chart using Fibonacci, swing low to high, price action pullback and test 38%, and retest 61% before rebounce to test the peak again. See chart.
Trade with eyes open.
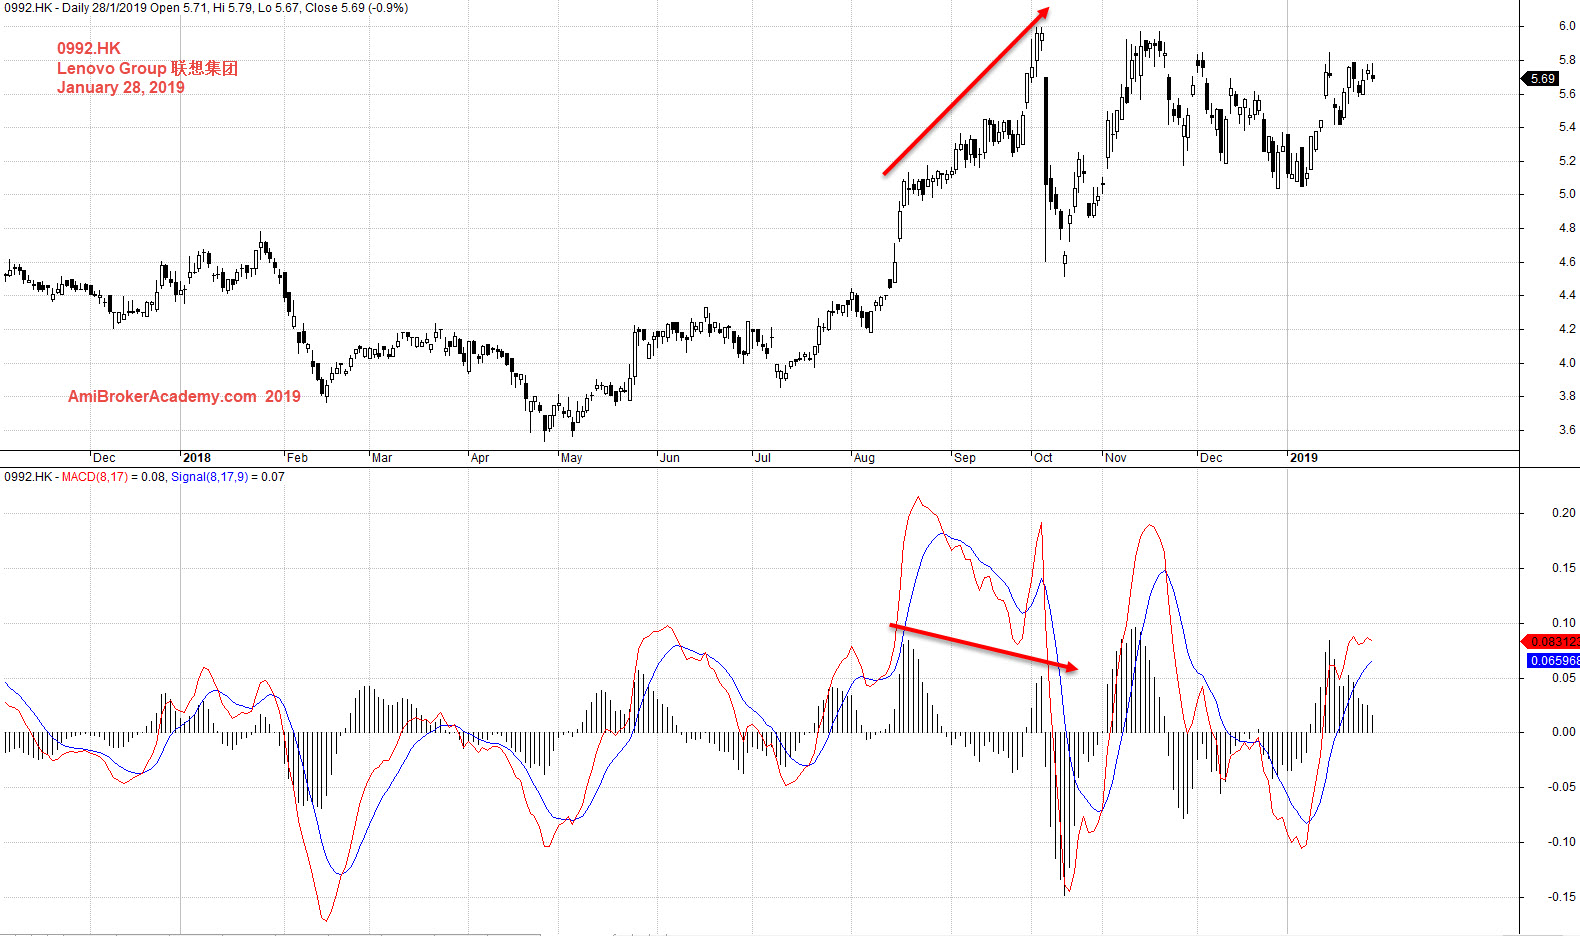
Study stock chart using MACD indicator.
See chart, price action forms higher high, and MACD-H forms lower high. Negative divergence.
Current price action is sideways.
2019012 Lenovo Group 联想集团 and MACD
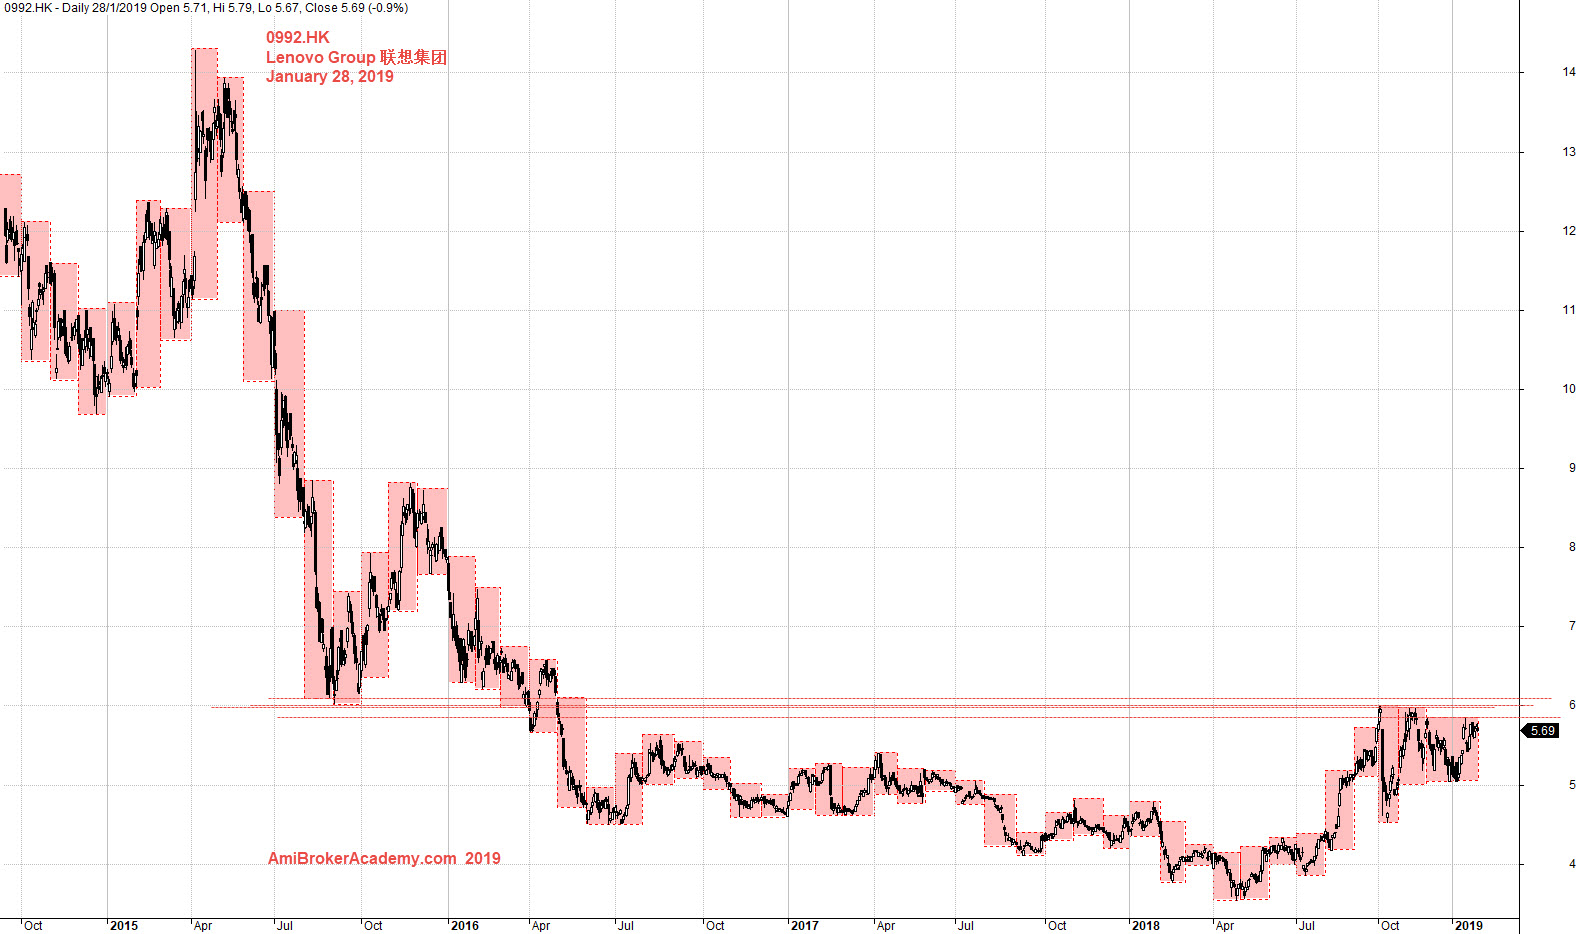
Zoom out and see more data, using month high low. You could see Lenovo drifted from above 14 Hong Kong Dollars to low, below HK $ 4. Now the price action get resisted by the previous support. See chart.
The current price action is somewhat near HK$6. Trade with eyes open.
2019012 Lenovo Group 联想集团 and Month High Low and Key Level
Moses
AmiBrokerAcademy.com
Disclaimer
The above result is for illustration purpose. It is not meant to be used for buy or sell decision. We do not recommend any particular stocks. If particular stocks of such are mentioned, they are meant as demonstration of Amibroker as a powerful charting software and MACD. Amibroker can program to scan the stocks for buy and sell signals.
These are script generated signals. Not all scan results are shown here. The MACD signal should use with price action. Users must understand what MACD and price action are all about before using them. If necessary you should attend a course to learn more on Technical Analysis (TA) and Moving Average Convergence Divergence, MACD.
Once again, the website does not guarantee any results or investment return based on the information and instruction you have read here. It should be used as learning aids only and if you decide to trade real money, all trading decision should be your own.