January 29, 2019
Welcome to AmiBrokerAcademy.com. We provide US stock analysis for academy learning.
Think!
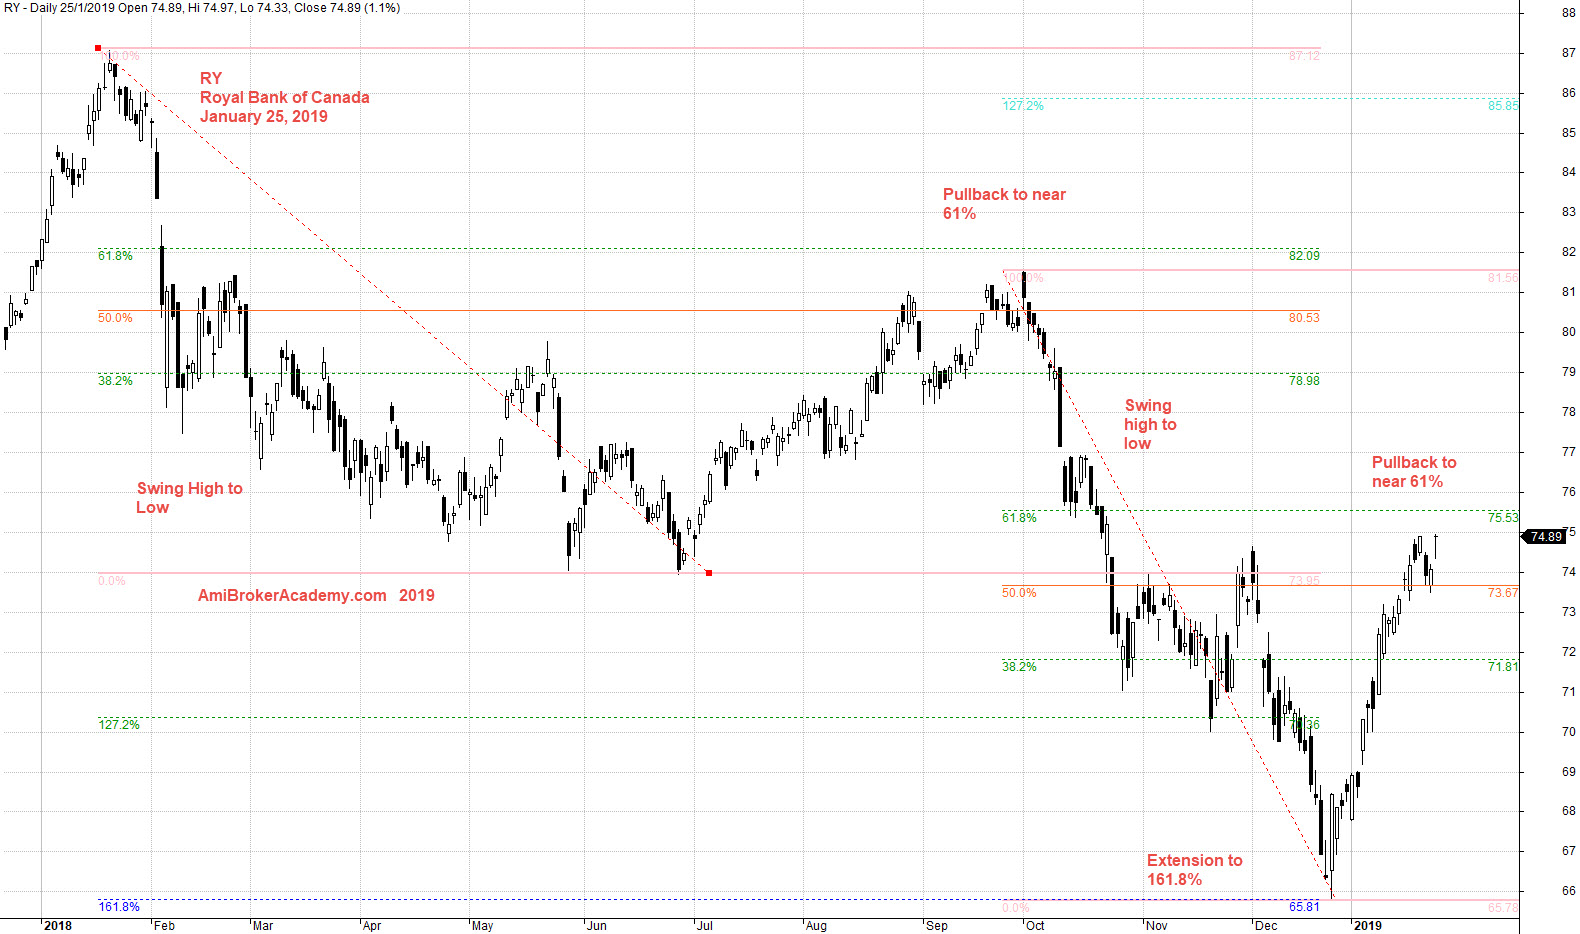
RY Royal Bank of Canada Stock Charting
Study Royal Bank of Canada stock chart using Fibonacci. First swing high to low, from 87 dollars to 74 dollars. You will find the price action nicely supported by the Fibo Extension at level 127%.
If we will do another Fibo retracement swing high to low from 82 dollars to 66 dollars, you will find the price action pullback and test the 61%, at 75 dollars.
Trade with eyes open.
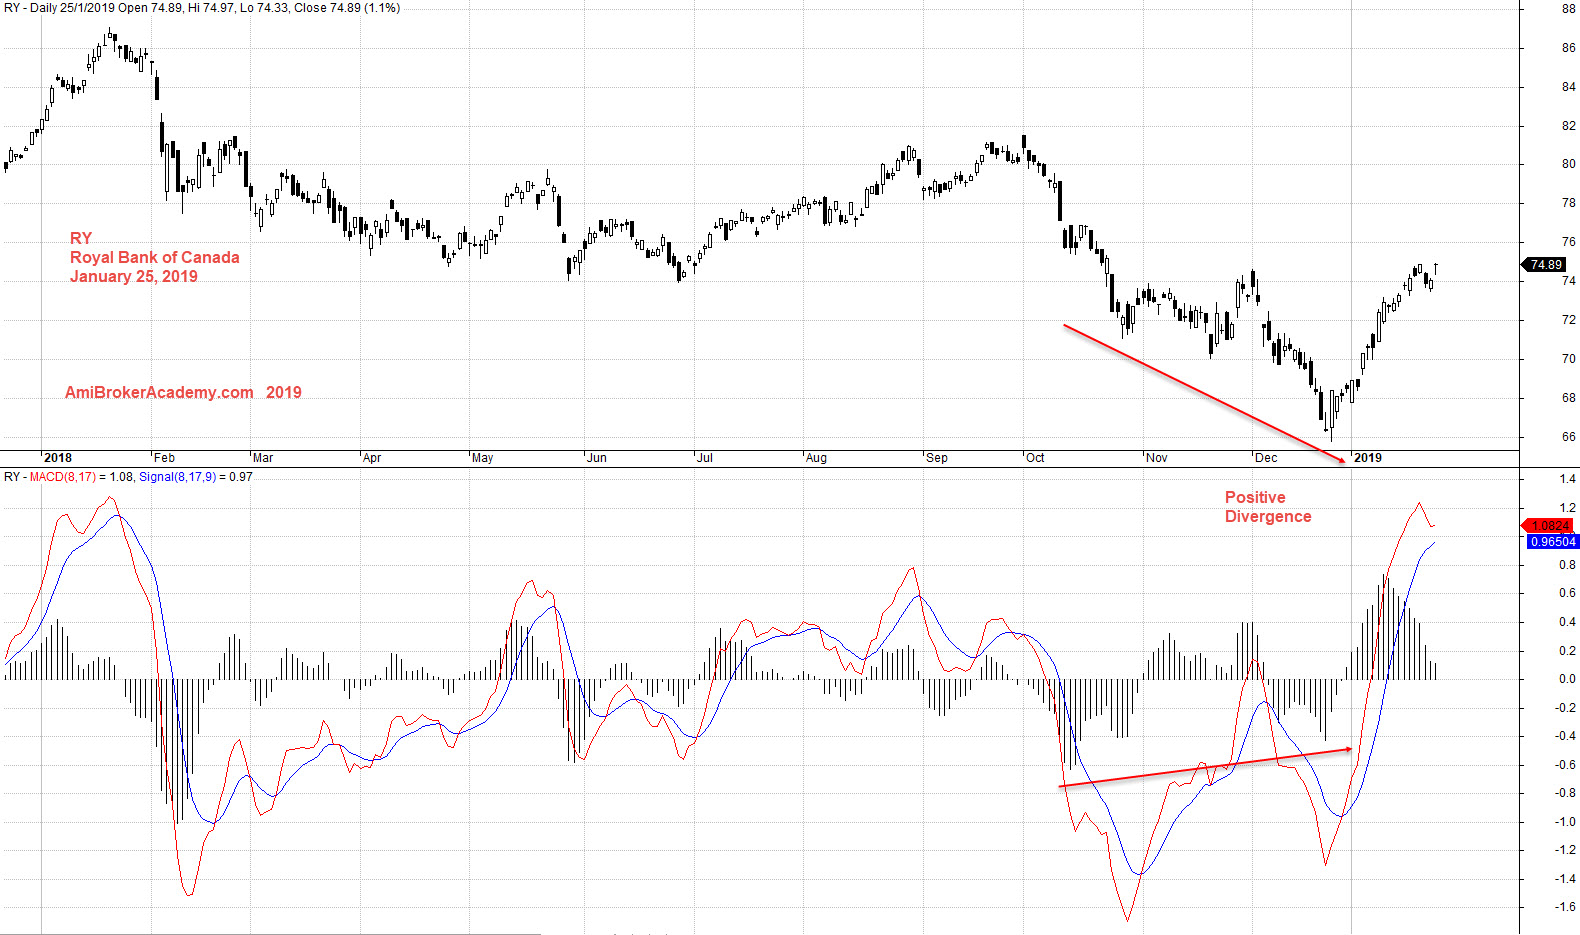
Add MACD indicator, see chart.
Moses Stock Analysis
AmiBrokerAcademy.com
Disclaimer
The above result is for illustration purpose. It is not meant to be used for buy or sell decision. We do not recommend any particular stocks. If particular stocks of such are mentioned, they are meant as demonstration of Amibroker as a powerful charting software and MACD. Amibroker can program to scan the stocks for buy and sell signals.
These are script generated signals. Not all scan results are shown here. The MACD signal should use with price action. Users must understand what MACD and price action are all about before using them. If necessary you should attend a course to learn more on Technical Analysis (TA) and Moving Average Convergence Divergence, MACD.
Once again, the website does not guarantee any results or investment return based on the information and instruction you have read here. It should be used as learning aids only and if you decide to trade real money, all trading decision should be your own.