14 December, 2018
Think think got more things.
Thanks for visiting the site.
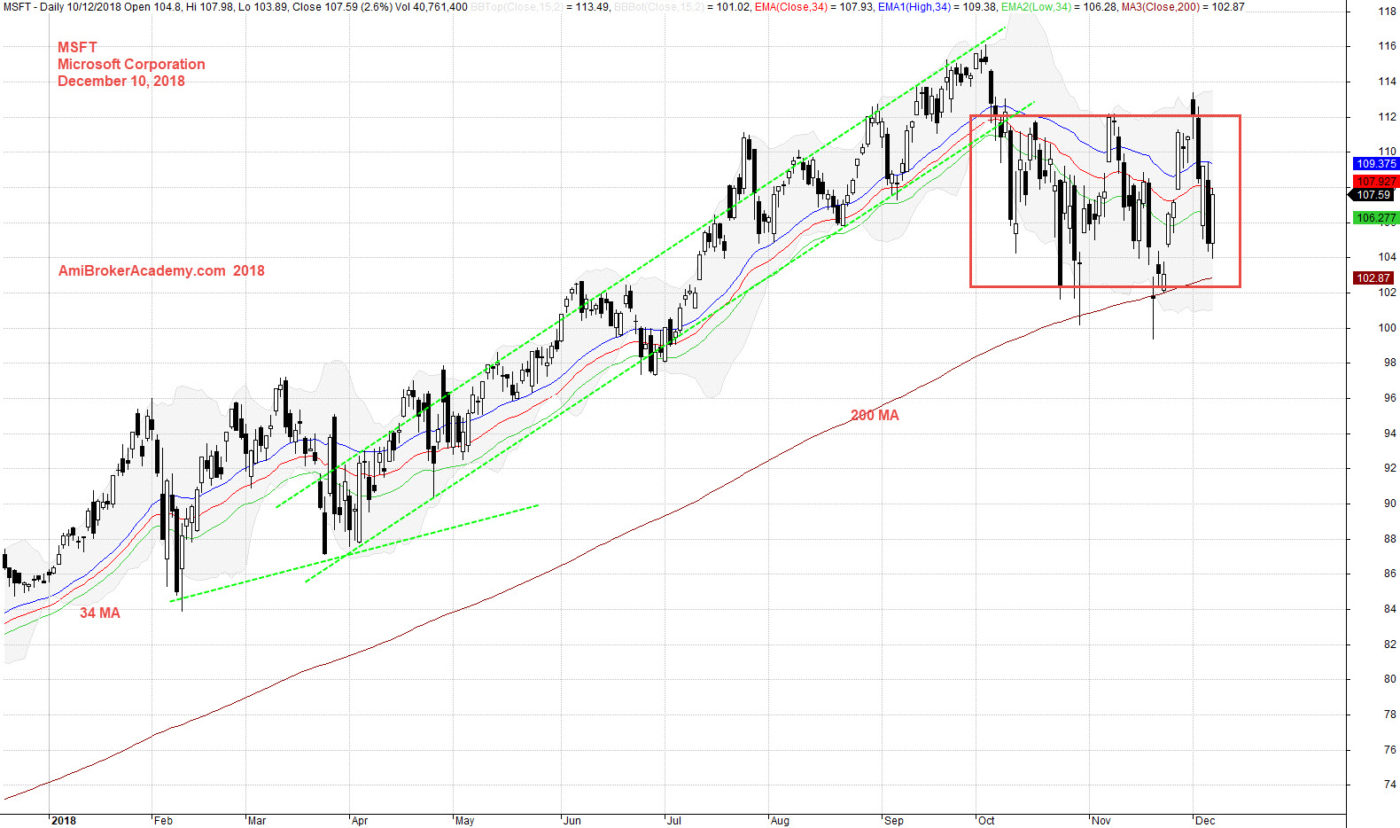
MSFT Microsoft Corporation Daily Chart
We strongly suggest you Buy Low Sell High
Or its Equal to Buy Support Sell Resistance
We see price action closed higher and higher for 2018 and hit the peak at 116 dollars.
You could see part of the price action is traveled in narrow channel.
But price action after the high of 116 dollars, and begin to fail and move south. The price action supported by the 200 MA, the price action instead of move south, its actually move sideways, see the box.
If you study the chart again, you will notice that the price action before close below MA, the price action was supported by MA.
Trade with your eyes open.
if you can see the full chart, “press Ctrl and -” to zoom out and see the entire chart.
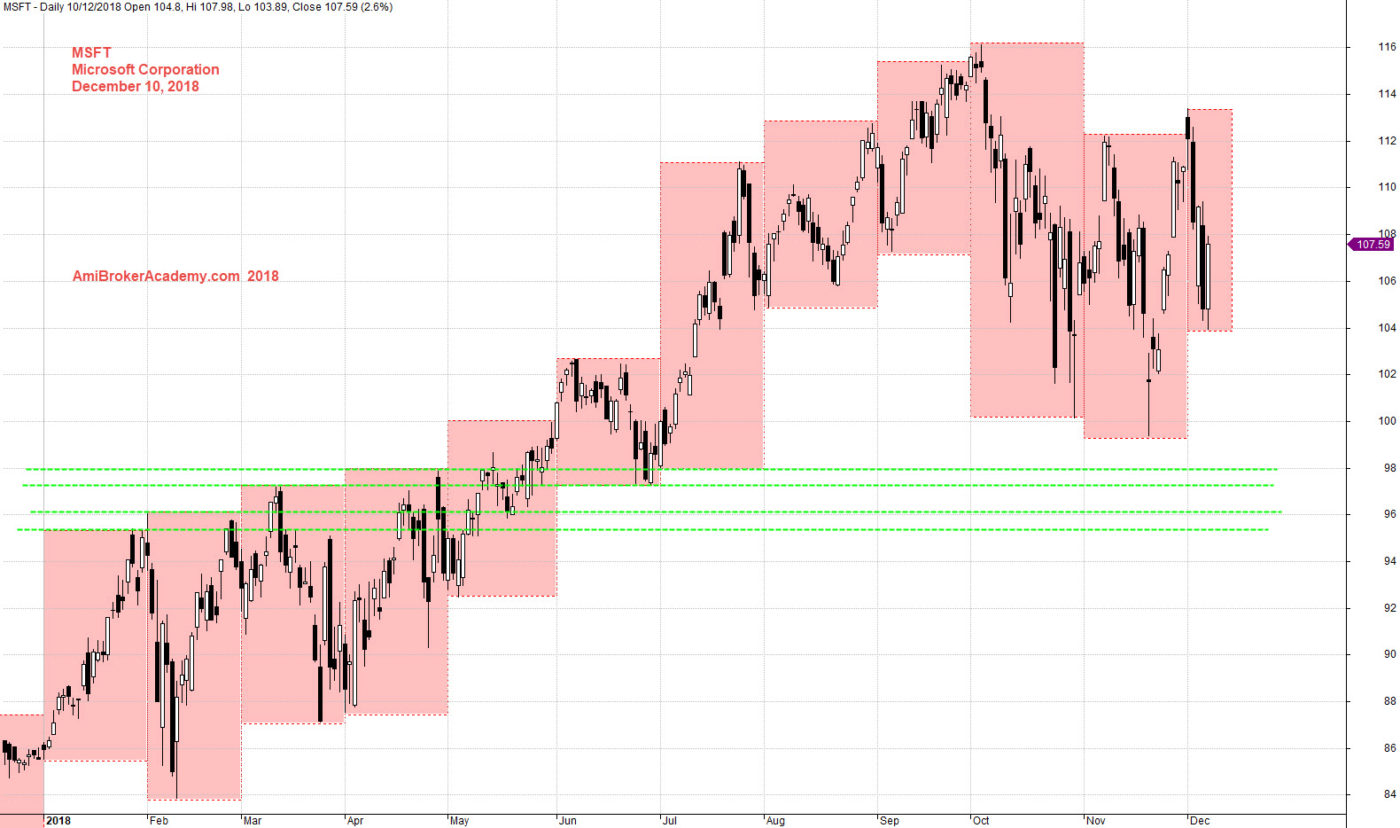
Study the chart from a support resistance perspective, we could use month high low as a reference.
Month high low is a good way to understand the market emotion, volatility. To facilitate the study, box is a good tool to handle this. The bigger the box, the greater the volatile. See chart, picture worth a thousand words.
So, from chart we can tell 2018 is a good year for Microsoft. It is on a bull trend. Imagine you invest on this stock, you will be alright. But, but be aware, the price action is now pullback to test the resistance in 2018, see chart.
Moses US Stock Chart Analysis
AmiBrokerAcademy.com
Disclaimer
The above result is for illustration purpose. It is not meant to be used for buy or sell decision. We do not recommend any particular stocks. If particular stocks of such are mentioned, they are meant as demonstration of Amibroker as a powerful charting software and MACD. Amibroker can program to scan the stocks for buy and sell signals.
These are script generated signals. Not all scan results are shown here. The MACD signal should use with price action. Users must understand what MACD and price action are all about before using them. If necessary you should attend a course to learn more on Technical Analysis (TA) and Moving Average Convergence Divergence, MACD.
Once again, the website does not guarantee any results or investment return based on the information and instruction you have read here. It should be used as learning aids only and if you decide to trade real money, all trading decision should be your own.