14 December, 2018
Thanks for visiting the site.
^DJI Dow Jones Industrial Average Index Daily Chart
Buy Low Sell High
Equal to Buy Support Sell Resistance
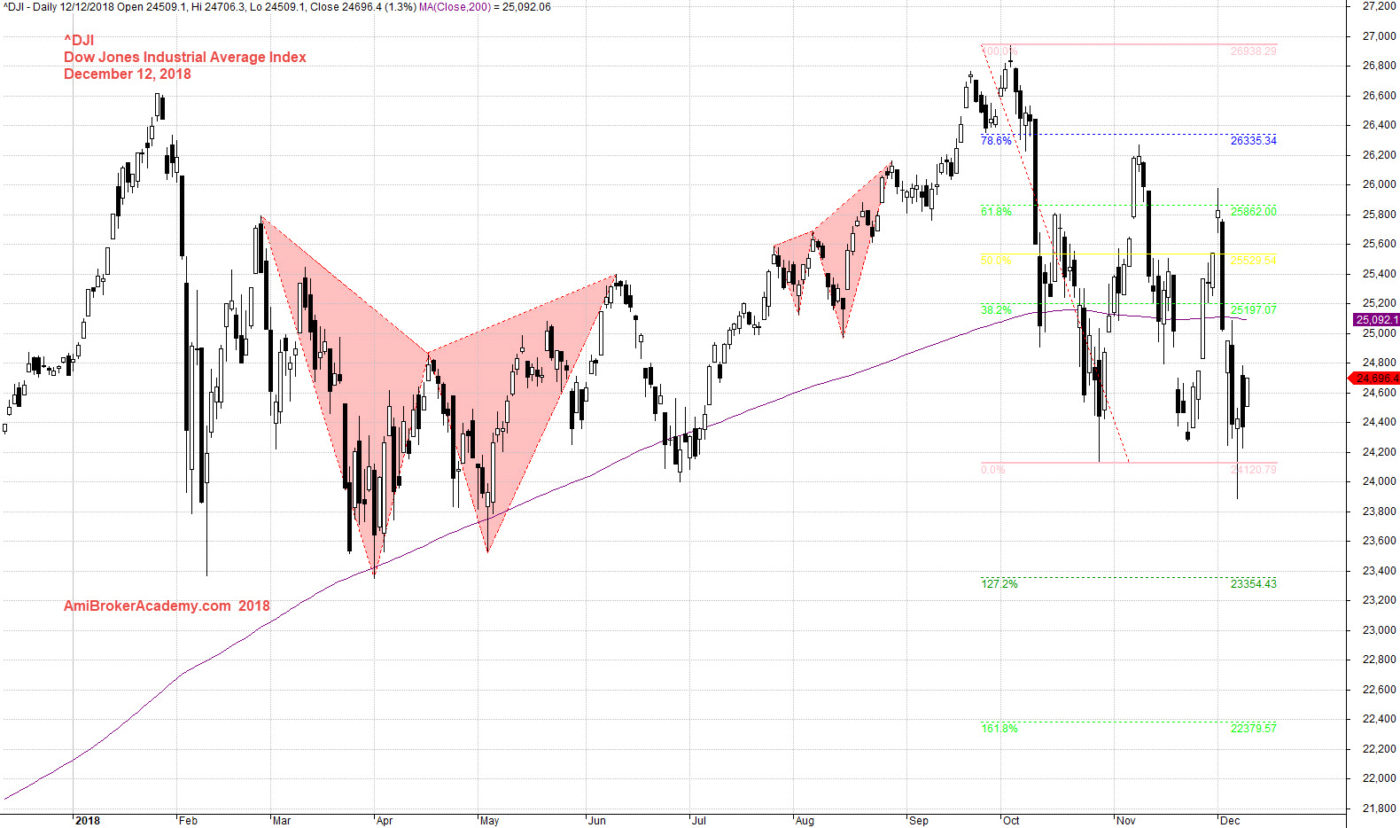
Some said, the market has topping. See chart, Dow Jones Industrial Average Index we see the price action has tested the 2018 high again. And that was back in October. Thereafter the price action begin to move south. We can see the market has been very confuse, as many try to buy up to prevent the bear trend. So, we can see price action keep pullback.
We use Fibonacci to measure the pullback. Swing high to low, from the high 27000 to the low 24200. We see the price action pullback to test 78% and fail, the price action rebounce again but the price action this time only reach 61%. Now he question is can price action hold at the 24200 level. Will see.
Trade with eyes open.
if you can see the full chart, “press Ctrl and -” to zoom out and see the entire chart.
Add Moving Average, use 34 period, high, low and close. We create a band, or river. We see price action close below River and stay below. At July, the price action close above River and stay above. October is the month the all stocks was bearish. The DJI close below River and stay below.
See chart, picture worth a thousand words.
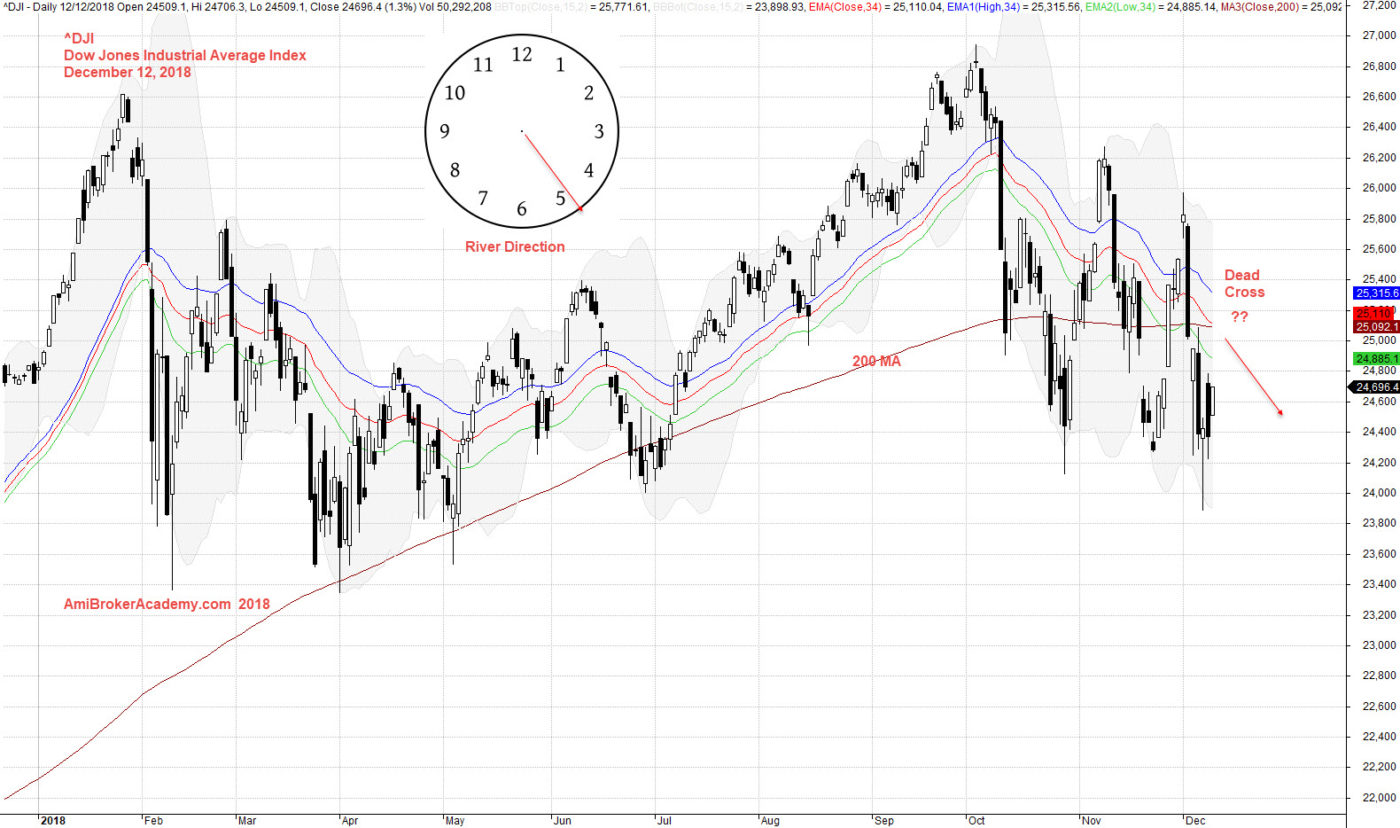
Study the stock chart using a different perspective, use support resistance. Add month high low, we can see the volatility.
Reference to H M Gartley pattern, see chart.

Moses US Stock Chart Analysis
AmiBrokerAcademy.com
Disclaimer
The above result is for illustration purpose. It is not meant to be used for buy or sell decision. We do not recommend any particular stocks. If particular stocks of such are mentioned, they are meant as demonstration of Amibroker as a powerful charting software and MACD. Amibroker can program to scan the stocks for buy and sell signals.
These are script generated signals. Not all scan results are shown here. The MACD signal should use with price action. Users must understand what MACD and price action are all about before using them. If necessary you should attend a course to learn more on Technical Analysis (TA) and Moving Average Convergence Divergence, MACD.
Once again, the website does not guarantee any results or investment return based on the information and instruction you have read here. It should be used as learning aids only and if you decide to trade real money, all trading decision should be your own.