January 24, 2018
US Stock Analysis
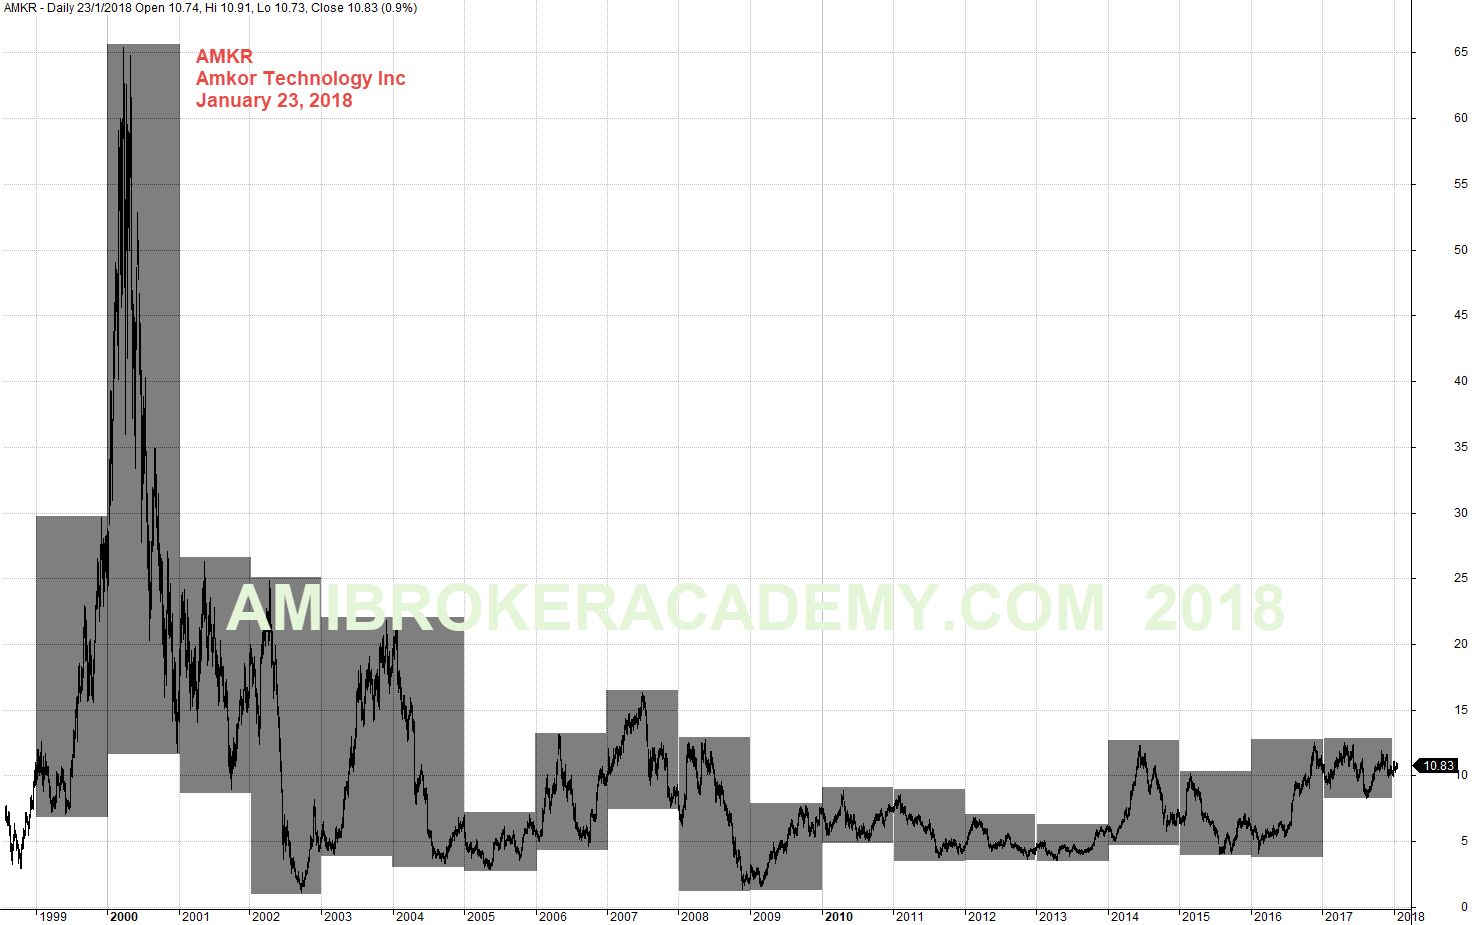
AMKR Amkor Technology Inc Year High Low From 1999
Picture worth a thousand words, Semiconductor and electronic were one of the very promising industry and sector, but now is no longer that attractive. AMKR stock price depict the whole story. With the changing technology and demand, the cost and price have drove down so much that the same goes with the market sentiment. No one will like to hold any of such tech stock, the price has drove down from 65 the peak in 1999 to near or below 5 in year 2002 and 2009. Now the stock like Amkor is only trading around 10 dollars. What a sad story! Those whom were attracted to join the company and still holding on the stock were very hard for them to dream at night.
Next I would like to say is trading has never be easy, only until the money is cash in. Otherwise, the money is just a paper money. Image you will issue and holding the stock say 50 dollars. And due to the contractual reason you can only start to sell your stock five years later, say 2005 or 2006. The best price you get may be 10 dollars, the worst time may be only 5 dollars. So what do you think, in fact many of the stuff just could not dream any more. A lost of 40 or 45 dollar a share. …
So, trust me, trading has never be easy. Not easy lah. Don’t play play (Singlish, Singapore English). Only easy to say buy here and sell there, in real life things just do not happen that way.
Picture worth a thousand words, see chart and think, think think (think more) and got more things. Have fun!
We will come back to look at the stock in relation with others stock and see how.
January 23, 2018 Amkor Technology Inc Year High Low From 1999
Manage your risk.
Powerful Chart Software – AmiBroker
The following chart is produced using AmiBroker charting software. It is a powerful chart software. You plot the stocks you are interested all in one chart, as long as you still could read them. See chart below.
Moses
AmiBrokerAcademy.com
Disclaimer
The above result is for illustration purpose. It is not meant to be used for buy or sell decision. We do not recommend any particular stocks. If particular stocks of such are mentioned, they are meant as demonstration of Amibroker as a powerful charting software and MACD. Amibroker can program to scan the stocks for buy and sell signals.
These are script generated signals. Not all scan results are shown here. The MACD signal should use with price action. Users must understand what MACD and price action are all about before using them. If necessary you should attend a course to learn more on Technical Analysis (TA) and Moving Average Convergence Divergence, MACD.
Once again, the website does not guarantee any results or investment return based on the information and instruction you have read here. It should be used as learning aids only and if you decide to trade real money, all trading decision should be your own.