January 24, 2018
US Stock Analysis
BIDU Baidu Inc Year High Low
If you use Chinese search engine, you should know 百度 Baidu. Familiar 百度一下?
Study chart, and see the price action try to hit 280 but fail and now try again. The high in 2017 is already breaking the high of 2014. Do you realize with the boxes for year high low, it is very much easy for your to spot what we just said? Have fun!
If you are Baidu, they think they are Google. Will whose know the outcome. We had seen there were example of technology company like Yahoo!, once they were the star in the sky. But not today. Can a company continue to do the right thing, not the thing the society wanted it? Same same will happen to many of the social media companies. Can today star be there tomorrow? No one will know, you can see many of the High Tech company have vanish from the global map. Who will be the next one? Do you know? I don’t.
Same same will be those e-companies. I believe you had seen the mobile phone industry too, who were the founder? And now who are the key players? There are not the same. Manage your risk, especially the high tech company. Watch the change in trend.
Picture worth a thousand words, see chart and think, think think (think more) and got more things. Have fun!
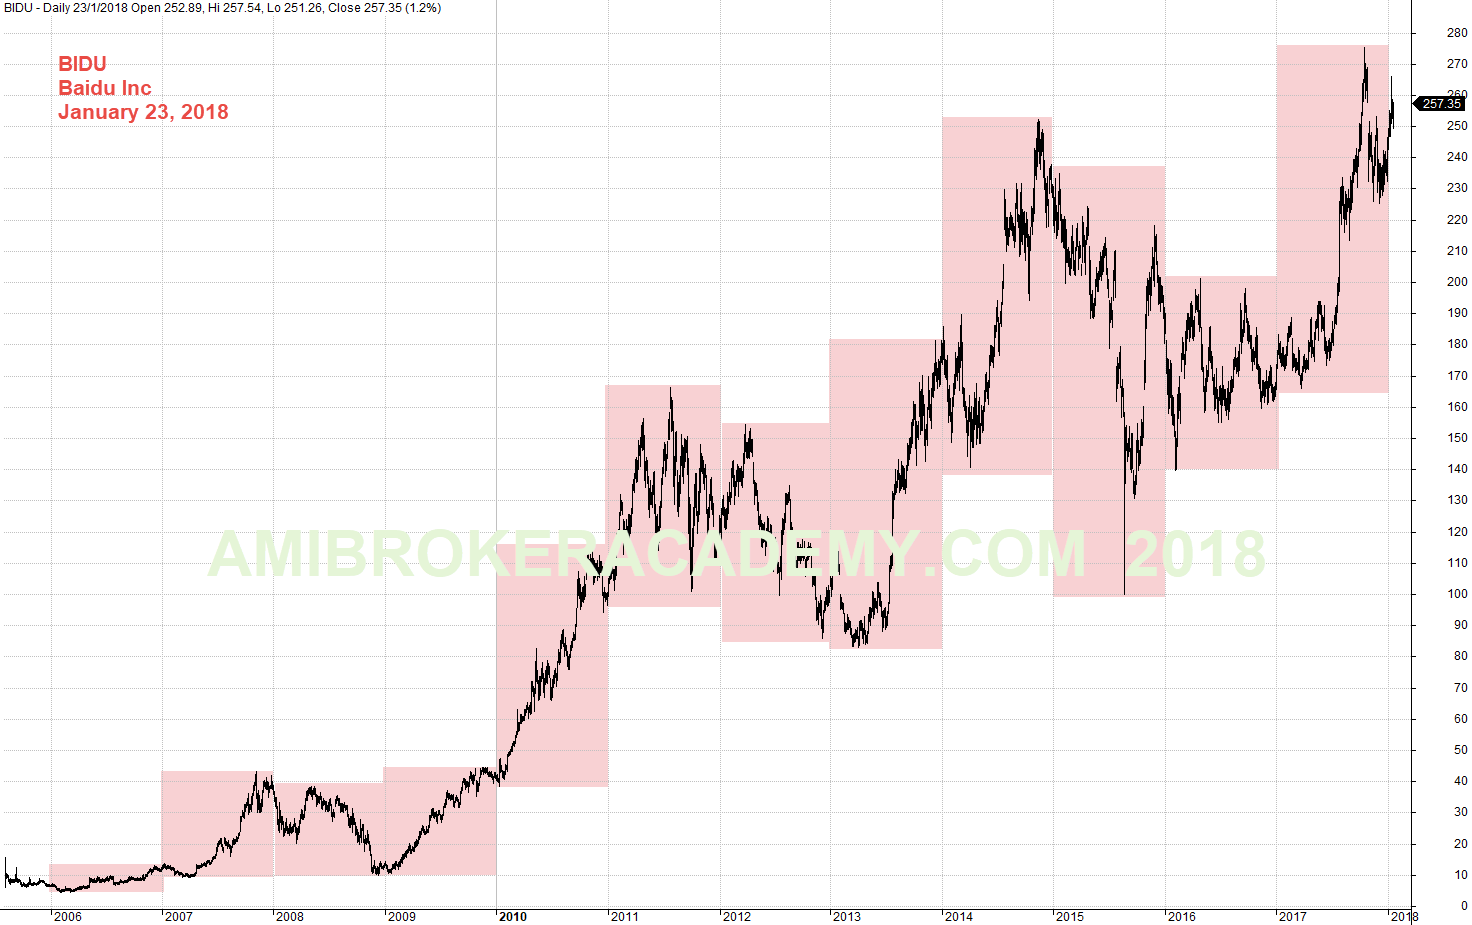
January 23, 2018 Baidu Inc Year High Low From 2006
Manage your risk.
Powerful Chart Software – AmiBroker
The following chart is produced using AmiBroker charting software. It is a powerful chart software. You plot the stocks you are interested all in one chart, as long as you still could read them. See chart below.
Moses
AmiBrokerAcademy.com
Disclaimer
The above result is for illustration purpose. It is not meant to be used for buy or sell decision. We do not recommend any particular stocks. If particular stocks of such are mentioned, they are meant as demonstration of Amibroker as a powerful charting software and MACD. Amibroker can program to scan the stocks for buy and sell signals.
These are script generated signals. Not all scan results are shown here. The MACD signal should use with price action. Users must understand what MACD and price action are all about before using them. If necessary you should attend a course to learn more on Technical Analysis (TA) and Moving Average Convergence Divergence, MACD.
Once again, the website does not guarantee any results or investment return based on the information and instruction you have read here. It should be used as learning aids only and if you decide to trade real money, all trading decision should be your own.