March 22, 2018
Can not remember I share this before?
Can not remember I share this before. Someone invite me to attend a preview, a society chairman talks. The person runs a training to teach people how to trade stock and make profit from stock. It was a well turn over for the preview, nearly full house for a forty seats class room. The trainer break the ice by asking the audience to make a buy or sell trade decision on a stock chart. Some say buy, some say sell. some say do not know to buy or sell.
In fact, his point was, buy or sell are all correct. As for any business, the business is either up or down. There isn’t anyone could make it all up or all down. The only key is what make you think is a sell and not buy or it is a buy and not sell. As long as you could justify for decision that is good. And it is important to be able to support your decision.
I ever told my staff that came to me for the decision. Yes, or not. My reply to the person was, if you have spent three weeks to study the case you should have the yes or no decision. If you want me to decide for you, you are taking a high risk. I am just like tossing a coin, head or tail, because I only see this the first time, and after your explanation and I pick a decision.
So, I always want the person to tell me what is his decision. I will than ask five, ten or more question to help him to see his blame spot.
So, please do not just listen to anyone idea do your homework. Manage your risk.
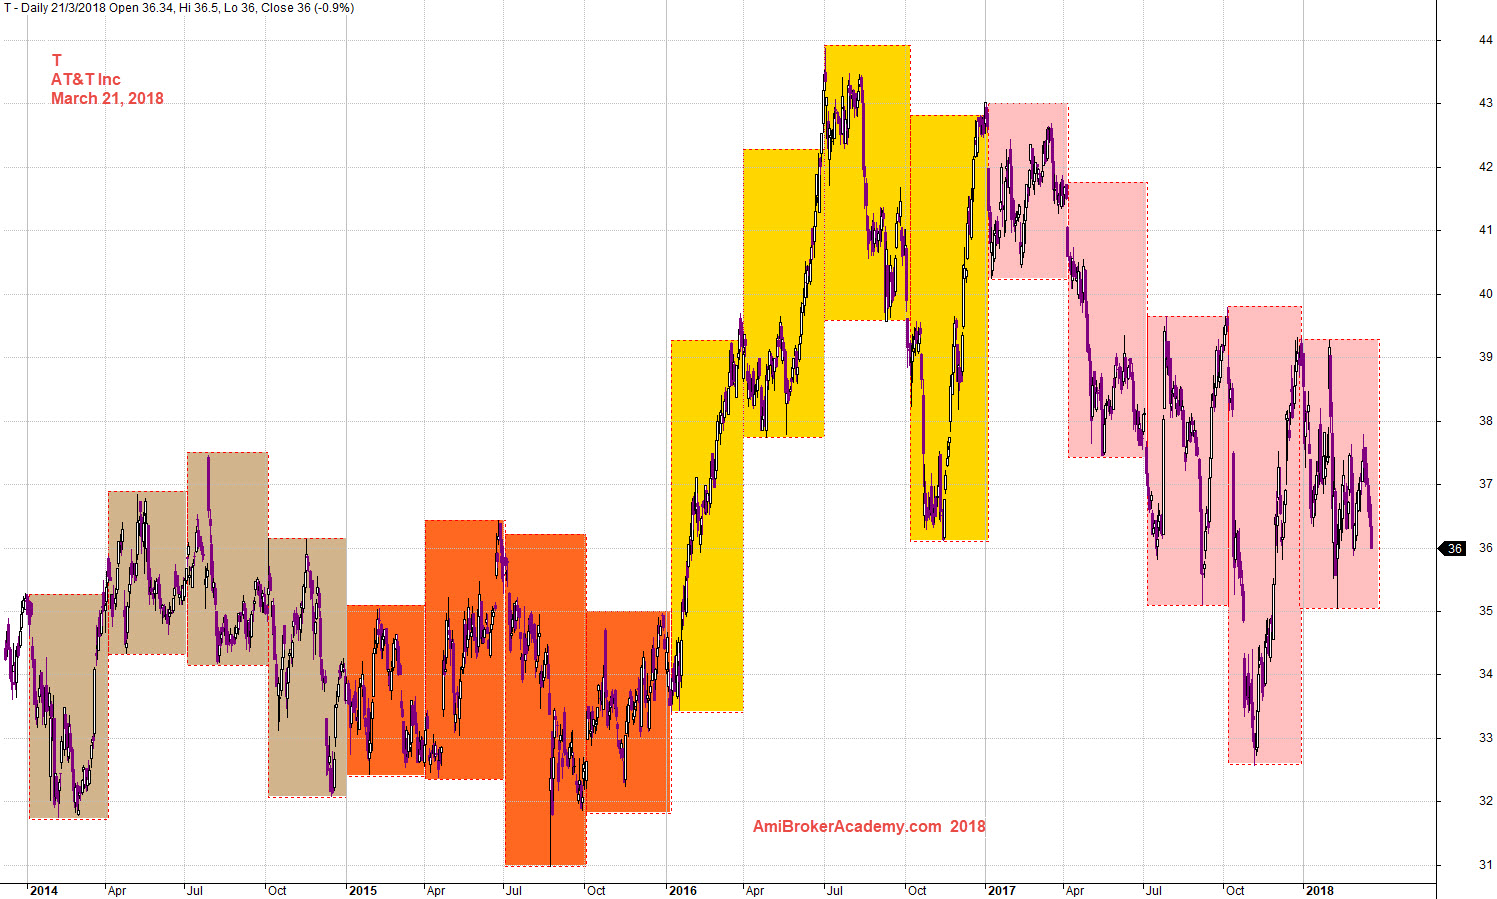
US Stock Chart Analysis
T AT&T Inc and Quarter High Low
Study chart, AT&T stock price has gone from low to high and low again. But at least the price is not as low as back in 2014. Study the chart, the best price was 44 in 2016, and the stock price start near 32 in 2014. Of course at one time was lower, 31. 2017 the stock price was try to go lower, but stop just slightly below 33. Manage your risk.
Powerful Chart Software – AmiBroker
The following chart is produced using AmiBroker charting software. It is a powerful chart software. Anything, finance ticket you could download from Yahoo! Finance you could plot them, those you are interested all in a chart, so you could analyse them.
March 21, 2018 AT&T Inc and Quarter High Low
Moses US Stock Chart Analysis
AmiBrokerAcademy.com
Disclaimer
The above result is for illustration purpose. It is not meant to be used for buy or sell decision. We do not recommend any particular stocks. If particular stocks of such are mentioned, they are meant as demonstration of Amibroker as a powerful charting software and MACD. Amibroker can program to scan the stocks for buy and sell signals.
These are script generated signals. Not all scan results are shown here. The MACD signal should use with price action. Users must understand what MACD and price action are all about before using them. If necessary you should attend a course to learn more on Technical Analysis (TA) and Moving Average Convergence Divergence, MACD.
Once again, the website does not guarantee any results or investment return based on the information and instruction you have read here. It should be used as learning aids only and if you decide to trade real money, all trading decision should be your own.