March 23, 2018
Oscillator Moving Average Convergence Divergence
MACD is a popular trend following momentum indicator that shows the relationship of two moving averages of prices action; the MACD line and signal line.
Four MACD Signals:
- Crossovers – Sell Strategy, MACD crosses below the signal line. Buy Strategy, MACD rallies above the signal line. It is advisable to wait for confirmation to reduce possible whipsaw.
- Divergence – The security price action diverges from the MACD. It signals the end of the current trend.
- Cross Zero Line – MACD moves above or below zero line. Upward trend: Cross above zero line, short MA above long MA. Downward trend: Cross below zero line, short MA below long MA.
- Dramatic rise or fall – MACD rises or decline dramatically – when the shorter moving average pulls away from the longer-term moving average – Oversold or Overbought.
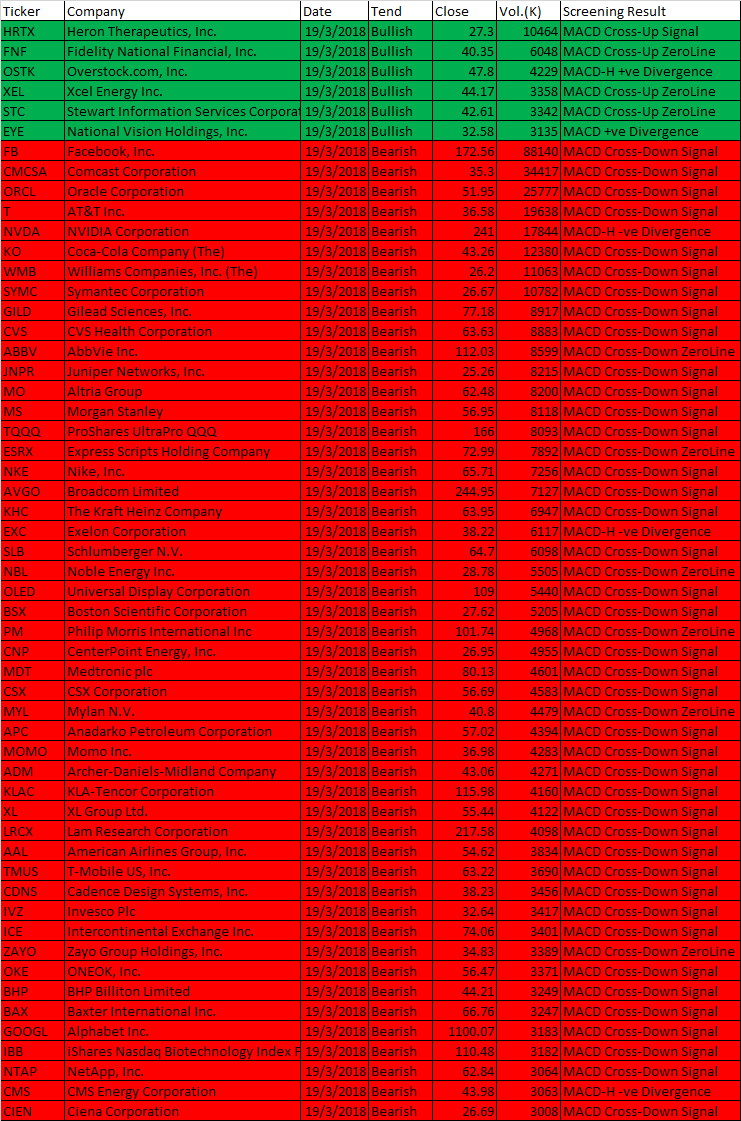
Free One-day US Stock MACD Screening Results for 19 March 2018
Remember all setup can fail. This is true for all indicators. It is also true for MACD signals setup. See some of the MACD setup fail examples on this website.
March 19, 2018 US Stock One-day MACD Scan Signals
- MACD line crosses above MACD signal – Bullish trend
- MACD line crosses above zero line – Bullish trend
- MACD Histogram +ve Divergence – Bullish trend
- MACD line crosses below MACD signal – Bearish trend
- MACD line crosses below zero line – Bearish trend
- MACD Histogram -ve Divergence – Bearish trend
| Ticker | Company | Date | Tend | Close | Vol.(K) | Screening Result |
| HRTX | Heron Therapeutics, Inc. | 19/3/2018 | Bullish | 27.3 | 10464 | MACD Cross-Up Signal |
| FNF | Fidelity National Financial, Inc. | 19/3/2018 | Bullish | 40.35 | 6048 | MACD Cross-Up ZeroLine |
| OSTK | Overstock.com, Inc. | 19/3/2018 | Bullish | 47.8 | 4229 | MACD-H +ve Divergence |
| XEL | Xcel Energy Inc. | 19/3/2018 | Bullish | 44.17 | 3358 | MACD Cross-Up ZeroLine |
| STC | Stewart Information Services Corporation | 19/3/2018 | Bullish | 42.61 | 3342 | MACD Cross-Up ZeroLine |
| EYE | National Vision Holdings, Inc. | 19/3/2018 | Bullish | 32.58 | 3135 | MACD +ve Divergence |
| FB | Facebook, Inc. | 19/3/2018 | Bearish | 172.56 | 88140 | MACD Cross-Down Signal |
| CMCSA | Comcast Corporation | 19/3/2018 | Bearish | 35.3 | 34417 | MACD Cross-Down Signal |
| ORCL | Oracle Corporation | 19/3/2018 | Bearish | 51.95 | 25777 | MACD Cross-Down Signal |
| T | AT&T Inc. | 19/3/2018 | Bearish | 36.58 | 19638 | MACD Cross-Down Signal |
| NVDA | NVIDIA Corporation | 19/3/2018 | Bearish | 241 | 17844 | MACD-H -ve Divergence |
| KO | Coca-Cola Company (The) | 19/3/2018 | Bearish | 43.26 | 12380 | MACD Cross-Down Signal |
| WMB | Williams Companies, Inc. (The) | 19/3/2018 | Bearish | 26.2 | 11063 | MACD Cross-Down Signal |
| SYMC | Symantec Corporation | 19/3/2018 | Bearish | 26.67 | 10782 | MACD Cross-Down Signal |
| GILD | Gilead Sciences, Inc. | 19/3/2018 | Bearish | 77.18 | 8917 | MACD Cross-Down Signal |
| CVS | CVS Health Corporation | 19/3/2018 | Bearish | 63.63 | 8883 | MACD Cross-Down Signal |
| ABBV | AbbVie Inc. | 19/3/2018 | Bearish | 112.03 | 8599 | MACD Cross-Down ZeroLine |
| JNPR | Juniper Networks, Inc. | 19/3/2018 | Bearish | 25.26 | 8215 | MACD Cross-Down Signal |
| MO | Altria Group | 19/3/2018 | Bearish | 62.48 | 8200 | MACD Cross-Down Signal |
| MS | Morgan Stanley | 19/3/2018 | Bearish | 56.95 | 8118 | MACD Cross-Down Signal |
| TQQQ | ProShares UltraPro QQQ | 19/3/2018 | Bearish | 166 | 8093 | MACD Cross-Down Signal |
| ESRX | Express Scripts Holding Company | 19/3/2018 | Bearish | 72.99 | 7892 | MACD Cross-Down ZeroLine |
| NKE | Nike, Inc. | 19/3/2018 | Bearish | 65.71 | 7256 | MACD Cross-Down Signal |
| AVGO | Broadcom Limited | 19/3/2018 | Bearish | 244.95 | 7127 | MACD Cross-Down Signal |
| KHC | The Kraft Heinz Company | 19/3/2018 | Bearish | 63.95 | 6947 | MACD Cross-Down Signal |
| EXC | Exelon Corporation | 19/3/2018 | Bearish | 38.22 | 6117 | MACD-H -ve Divergence |
| SLB | Schlumberger N.V. | 19/3/2018 | Bearish | 64.7 | 6098 | MACD Cross-Down Signal |
| NBL | Noble Energy Inc. | 19/3/2018 | Bearish | 28.78 | 5505 | MACD Cross-Down ZeroLine |
| OLED | Universal Display Corporation | 19/3/2018 | Bearish | 109 | 5440 | MACD Cross-Down Signal |
| BSX | Boston Scientific Corporation | 19/3/2018 | Bearish | 27.62 | 5205 | MACD Cross-Down Signal |
| PM | Philip Morris International Inc | 19/3/2018 | Bearish | 101.74 | 4968 | MACD Cross-Down ZeroLine |
| CNP | CenterPoint Energy, Inc. | 19/3/2018 | Bearish | 26.95 | 4955 | MACD Cross-Down Signal |
| MDT | Medtronic plc | 19/3/2018 | Bearish | 80.13 | 4601 | MACD Cross-Down Signal |
| CSX | CSX Corporation | 19/3/2018 | Bearish | 56.69 | 4583 | MACD Cross-Down Signal |
| MYL | Mylan N.V. | 19/3/2018 | Bearish | 40.8 | 4479 | MACD Cross-Down ZeroLine |
| APC | Anadarko Petroleum Corporation | 19/3/2018 | Bearish | 57.02 | 4394 | MACD Cross-Down Signal |
| MOMO | Momo Inc. | 19/3/2018 | Bearish | 36.98 | 4283 | MACD Cross-Down Signal |
| ADM | Archer-Daniels-Midland Company | 19/3/2018 | Bearish | 43.06 | 4271 | MACD Cross-Down Signal |
| KLAC | KLA-Tencor Corporation | 19/3/2018 | Bearish | 115.98 | 4160 | MACD Cross-Down Signal |
| XL | XL Group Ltd. | 19/3/2018 | Bearish | 55.44 | 4122 | MACD Cross-Down Signal |
| LRCX | Lam Research Corporation | 19/3/2018 | Bearish | 217.58 | 4098 | MACD Cross-Down Signal |
| AAL | American Airlines Group, Inc. | 19/3/2018 | Bearish | 54.62 | 3834 | MACD Cross-Down Signal |
| TMUS | T-Mobile US, Inc. | 19/3/2018 | Bearish | 63.22 | 3690 | MACD Cross-Down Signal |
| CDNS | Cadence Design Systems, Inc. | 19/3/2018 | Bearish | 38.23 | 3456 | MACD Cross-Down Signal |
| IVZ | Invesco Plc | 19/3/2018 | Bearish | 32.64 | 3417 | MACD Cross-Down Signal |
| ICE | Intercontinental Exchange Inc. | 19/3/2018 | Bearish | 74.06 | 3401 | MACD Cross-Down Signal |
| ZAYO | Zayo Group Holdings, Inc. | 19/3/2018 | Bearish | 34.83 | 3389 | MACD Cross-Down ZeroLine |
| OKE | ONEOK, Inc. | 19/3/2018 | Bearish | 56.47 | 3371 | MACD Cross-Down Signal |
| BHP | BHP Billiton Limited | 19/3/2018 | Bearish | 44.21 | 3249 | MACD Cross-Down Signal |
| BAX | Baxter International Inc. | 19/3/2018 | Bearish | 66.76 | 3247 | MACD Cross-Down Signal |
| GOOGL | Alphabet Inc. | 19/3/2018 | Bearish | 1100.07 | 3183 | MACD Cross-Down Signal |
| IBB | iShares Nasdaq Biotechnology Index Fund | 19/3/2018 | Bearish | 110.48 | 3182 | MACD Cross-Down Signal |
| NTAP | NetApp, Inc. | 19/3/2018 | Bearish | 62.84 | 3064 | MACD Cross-Down Signal |
| CMS | CMS Energy Corporation | 19/3/2018 | Bearish | 43.98 | 3063 | MACD-H -ve Divergence |
| CIEN | Ciena Corporation | 19/3/2018 | Bearish | 26.69 | 3008 | MACD Cross-Down Signal |
Have fun!Users must understand what MACD is all about before using the results.
Moses US Stock Scan
AmiBroker Academy.com
Disclaimer:
The above result is for illustration purpose. It is not meant to be used for buy or sell decision. We do not recommend any particular stocks. If particular stocks of such are mentioned, they are meant as demonstration of Amibroker as a powerful charting software and MACD. Amibroker can program to scan the stocks for buy and sell signals.
These are script generated signals. Not all scan results are shown here. The MACD signal should use with price action. Users must understand what MACD and price action are all about before using them. If necessary you should attend a course to learn more on Technical Analysis (TA) and Moving Average Convergence Divergence, MACD.
Once again, the website does not guarantee any results or investment return based on the information and instruction you have read here. It should be used as learning aids only and if you decide to trade real money, all trading decision should be your own.