23 October, 2018
Thanks for visiting the site.
Moses Stock Stories – Think Think Got More Things
0700.HK Tencent Holdings 腾讯控股 Charting
We study Tencent Holdings 腾讯控股 stock chart. We see Tencent Holdings 腾讯控股 started as low as 30 and all the way to the peak near 480 Hong Kong dollars. But starting this year, 2018 the price close below moving average and stay below moving average. The stock price has gone from the high to the new level near 260 dollars. This may be a results of the Donald Trump’s tariff policy, the 45th U.S. President action. Trade with eyes open.
Manage Your Risk!
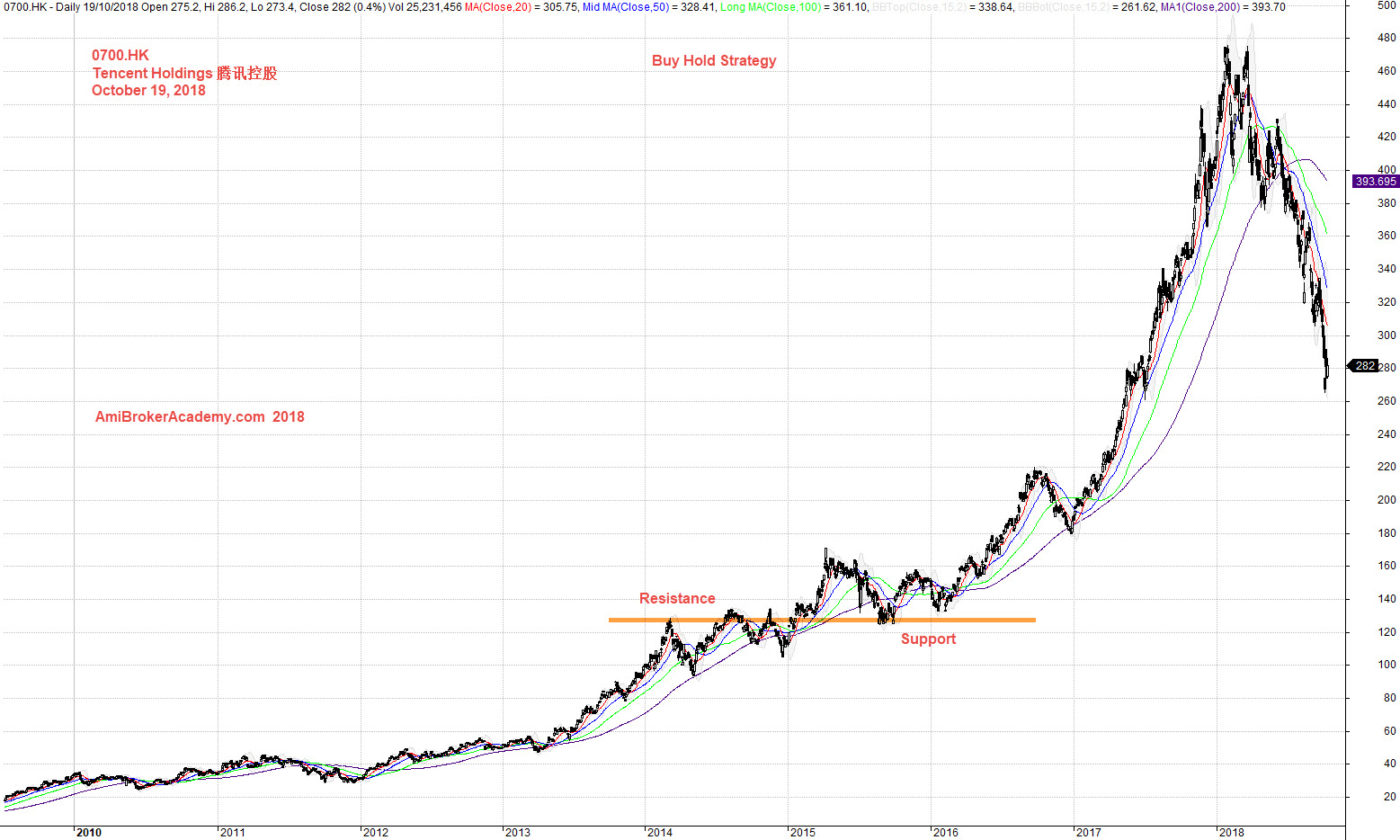
October 19, 2018 Tencent Holdings 腾讯控股 Buy Hold Strategy
If you can see the whole chart, “press Ctrl and -” to zoom out to see the entire chart.
Add 34 period moving average, high low and close, river. We see first the price action bounce above the River, bull trend. Thereafter the price action closes below the River and stay below the river, bear trend. If we add 200 moving average we see the fast MA cross below slow MA. This signal a bear trend too. Trade with eyes open.
If you are H M Gartley fan, you could easily spot many H M Gartley 222 pattern, see chart. Picture worth a thousand words.
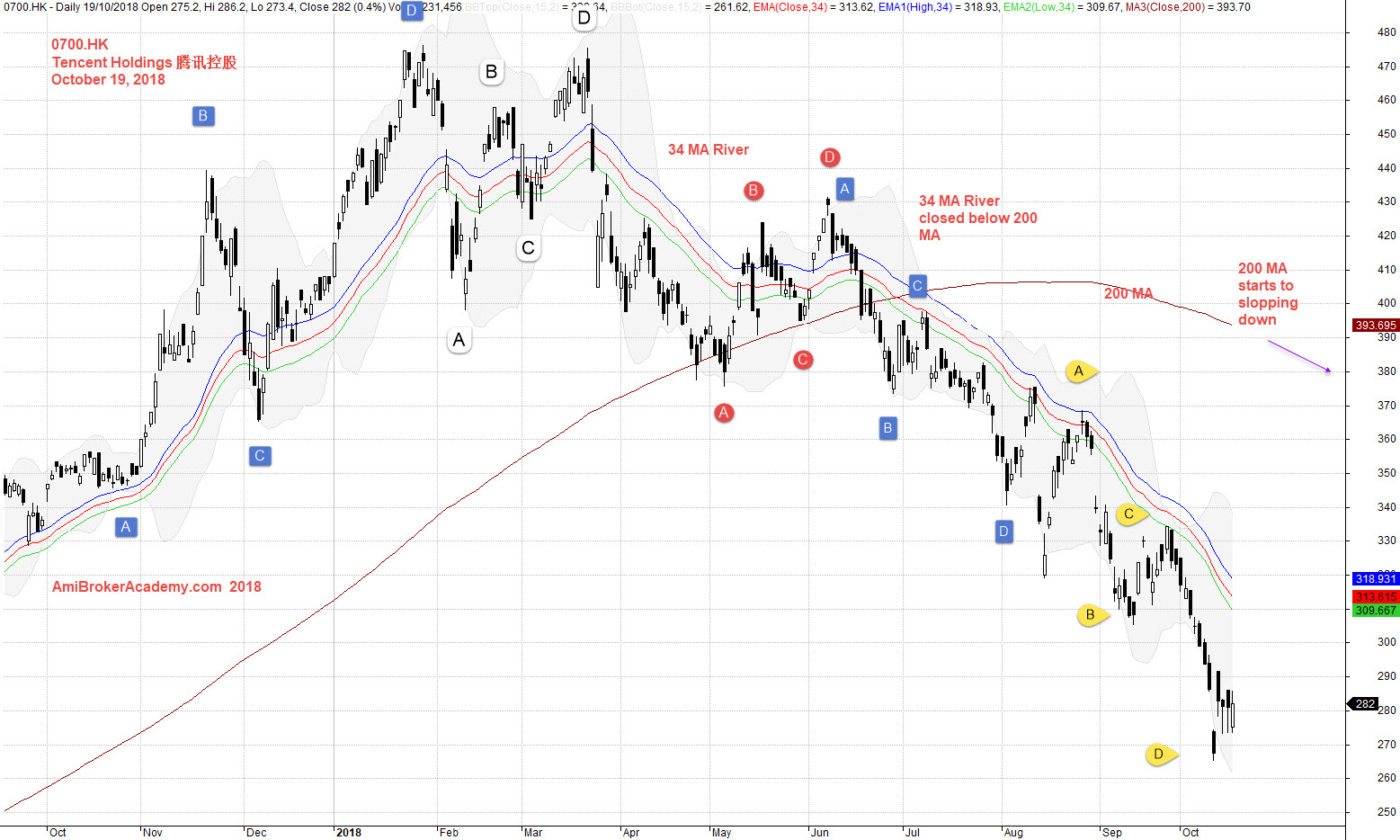
October 19, 2018 Tencent Holdings 腾讯控股 and River
Add 20 50, 100 and 200 moving averages, see chart. Picture worth a thousand words.
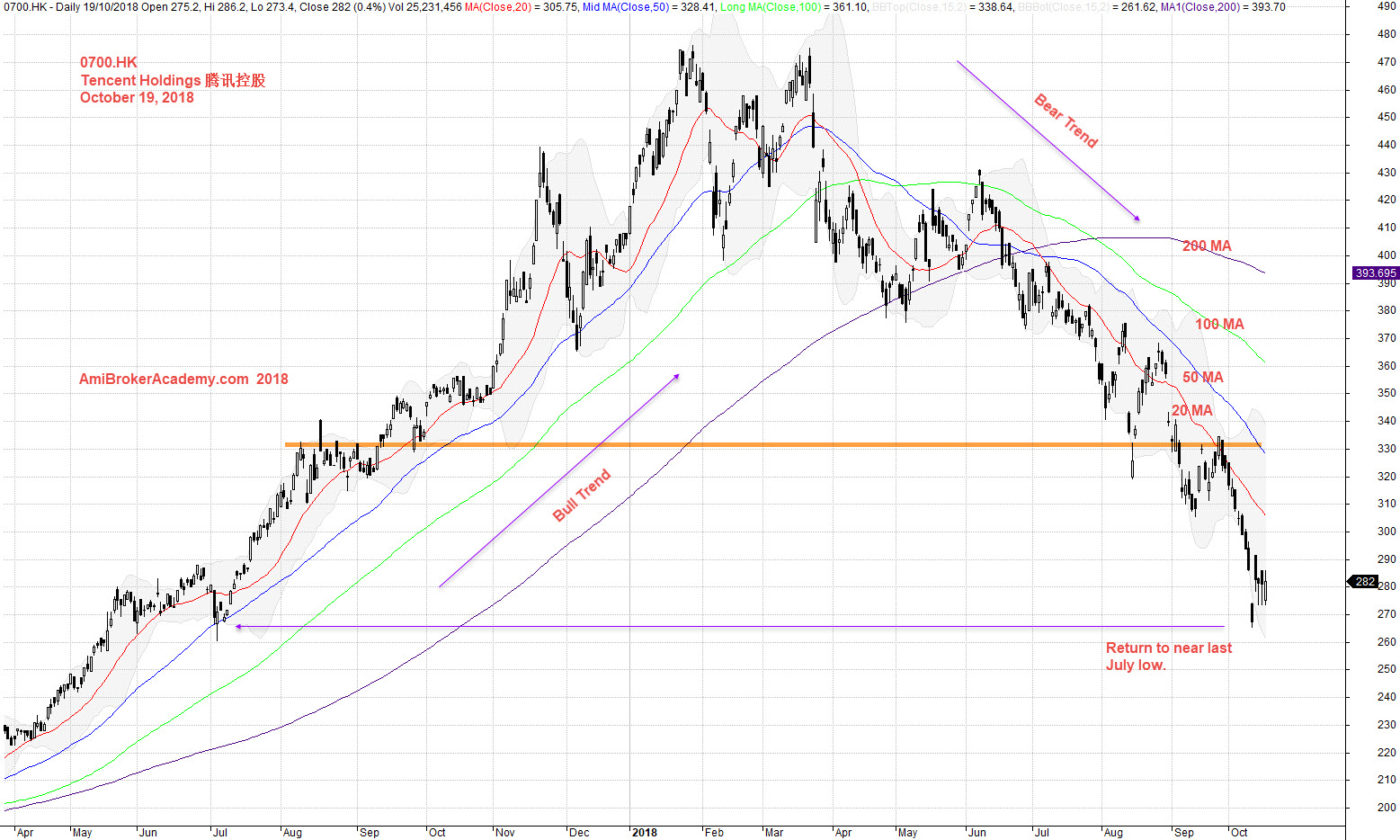
October 19, 2018 Tencent Holdings 腾讯控股 and Moving Averages
Moses
AmiBrokerAcademy.com
Disclaimer
The above result is for illustration purpose. It is not meant to be used for buy or sell decision. We do not recommend any particular stocks. If particular stocks of such are mentioned, they are meant as demonstration of Amibroker as a powerful charting software and MACD. Amibroker can program to scan the stocks for buy and sell signals.
These are script generated signals. Not all scan results are shown here. The MACD signal should use with price action. Users must understand what MACD and price action are all about before using them. If necessary you should attend a course to learn more on Technical Analysis (TA) and Moving Average Convergence Divergence, MACD.
Once again, the website does not guarantee any results or investment return based on the information and instruction you have read here. It should be used as learning aids only and if you decide to trade real money, all trading decision should be your own.