October 23, 2018
Thanks for visiting the site.
‘October Effect’
Study October Effect although October effect is only a theory. The stocks tend to decline during the month of October.
Moses Stock Stories
^AORD All Ordinaries Index Charting
Study All Ordinaries index, see price action picture worth a thousand words. See the market continue to decline after September deep.
The Index seems to have “October Effect”, the price action has declined.
The index has begin the bull trend fro 2016, see chart. Support Resistance has played a great role in support the price action.
Trade with your eyes open.
Manage Your Risk!
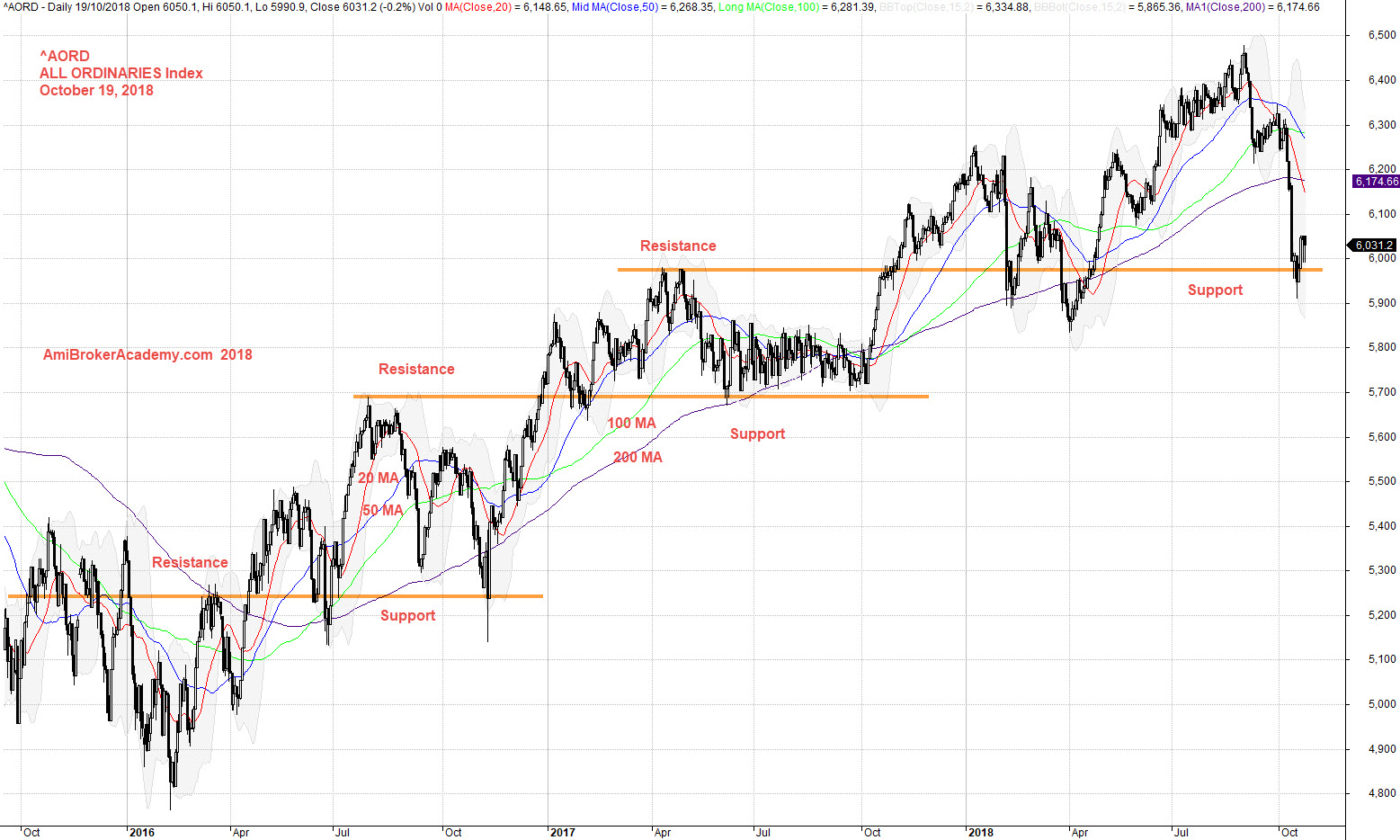
October 19, 2018 All Ordinaries Index and Support Resistance
If you can see the whole chart, “press Ctrl and -” to zoom out to see the entire chart.
Moses
AmiBrokerAcademy.com
Disclaimer
The above result is for illustration purpose. It is not meant to be used for buy or sell decision. We do not recommend any particular stocks. If particular stocks of such are mentioned, they are meant as demonstration of Amibroker as a powerful charting software and MACD. Amibroker can program to scan the stocks for buy and sell signals.
These are script generated signals. Not all scan results are shown here. The MACD signal should use with price action. Users must understand what MACD and price action are all about before using them. If necessary you should attend a course to learn more on Technical Analysis (TA) and Moving Average Convergence Divergence, MACD.
Once again, the website does not guarantee any results or investment return based on the information and instruction you have read here. It should be used as learning aids only and if you decide to trade real money, all trading decision should be your own.