12 December, 2018
Think think got more things.
Thanks for visiting the site.
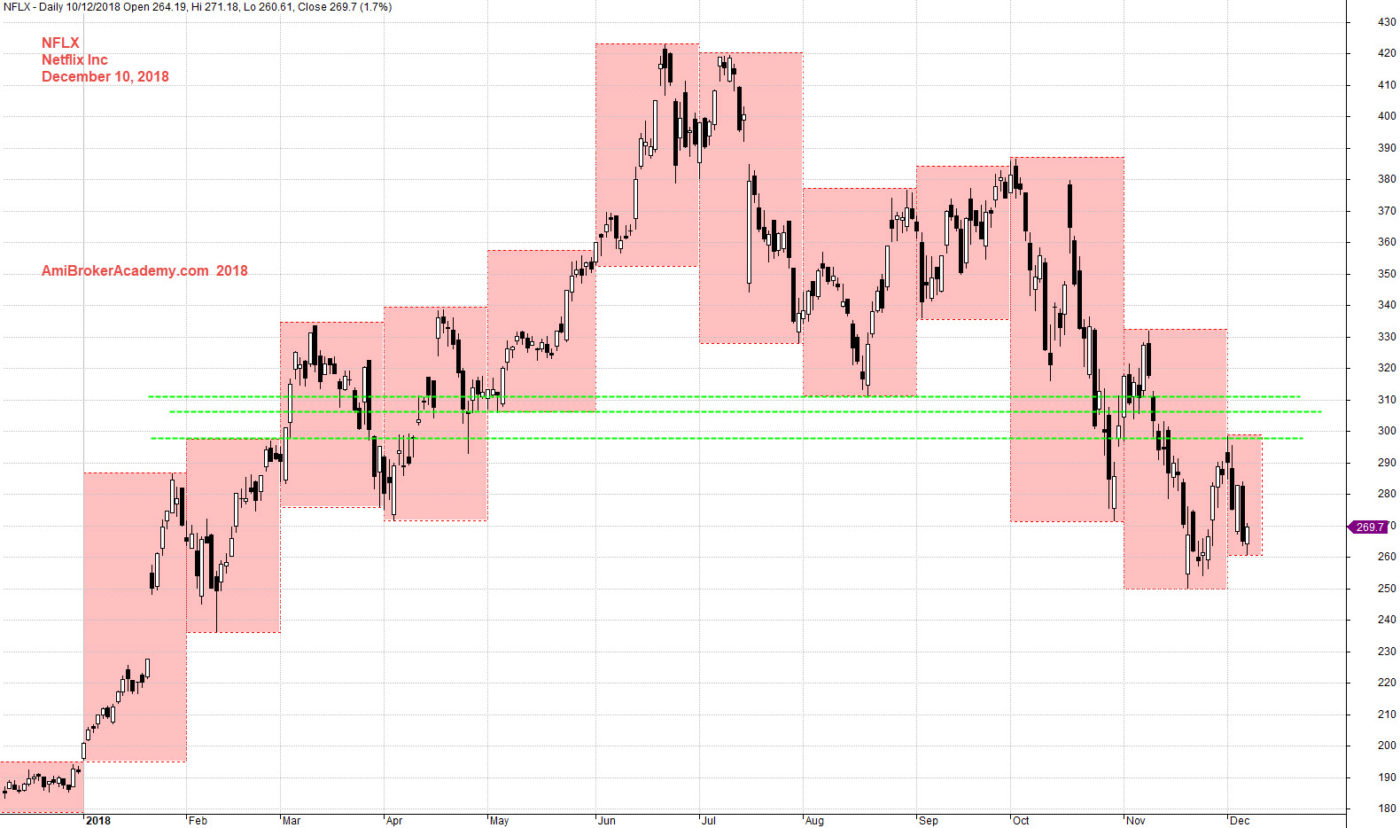
NFLX Netflix Inc Daily Chart
Buy Low Sell High
Equal to Buy Support Sell Resistance
Price action closed higher and higher to the peak at 420 dollars. Thereafter the price action fail to close any higher. Why? If you are also trading other stocks, you will notice, July seem to be the difficult month for all. Everyone is selling off to cash in. Netflix can’t stay out of this too. The price action begin to drift south. The price action begin to close lower and lower. Price action tested 250 dollars and rebounce up. But the price action is resisted by the great level, the support resistance level, see chart. Picture worth a thousand words.
Trade with your eyes open.
if you can see the full chart, “press Ctrl and -” to zoom out and see the entire chart.
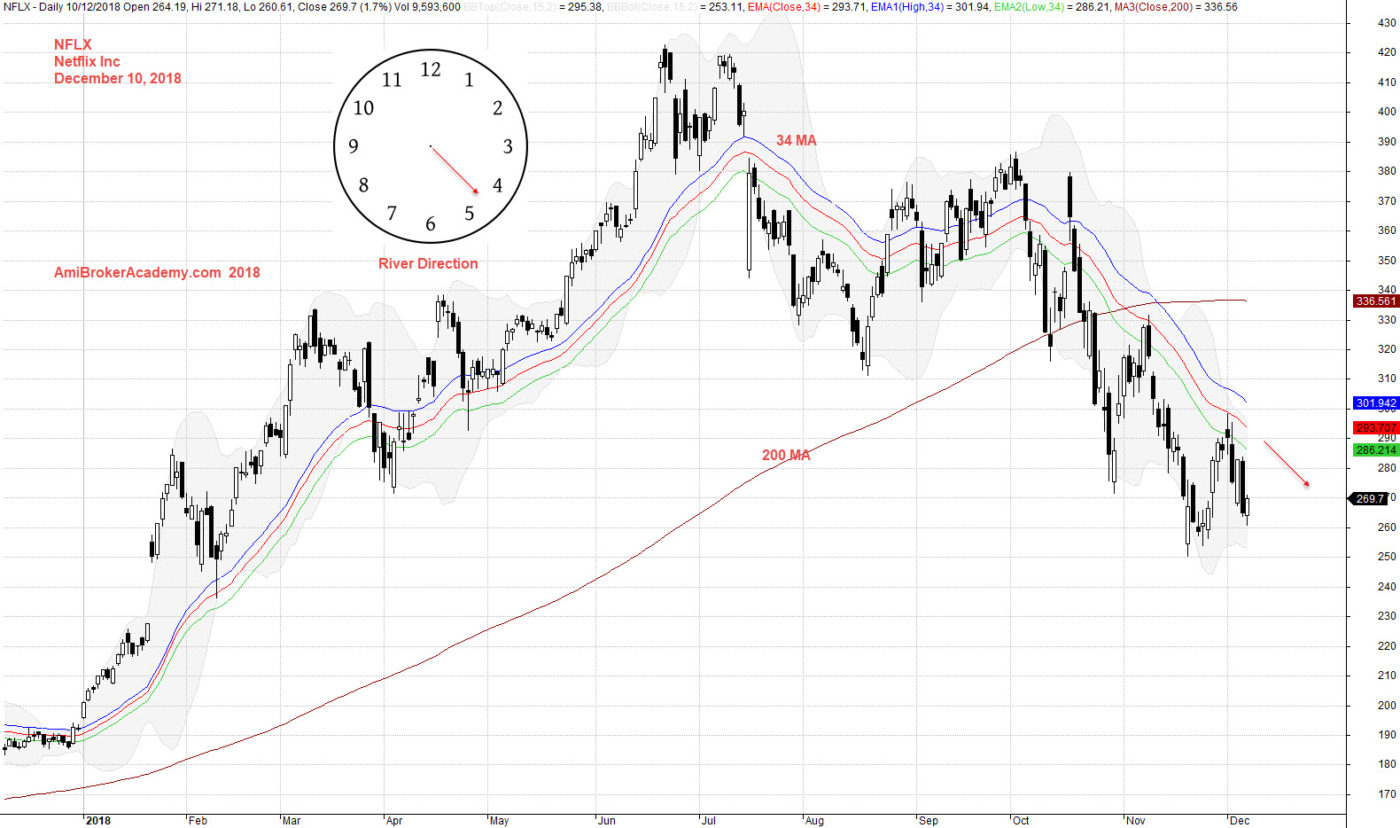
From the chart below, we add moving averages, we add 34 period, high, low and close MA. We see price action bounce on the MA at first, then close below MA, and resisted by MA and price action continue to stay below MA. The high, low and close 34 MA, we call them river. So, the river slopping up, sideways, and slopping down. From chart we see, bull, sideways and bear trend.
It is great if you could just reference to the river to buy and taking profit. Trade with eyes open.
Moses US Stock Chart Analysis
AmiBrokerAcademy.com
Disclaimer
The above result is for illustration purpose. It is not meant to be used for buy or sell decision. We do not recommend any particular stocks. If particular stocks of such are mentioned, they are meant as demonstration of Amibroker as a powerful charting software and MACD. Amibroker can program to scan the stocks for buy and sell signals.
These are script generated signals. Not all scan results are shown here. The MACD signal should use with price action. Users must understand what MACD and price action are all about before using them. If necessary you should attend a course to learn more on Technical Analysis (TA) and Moving Average Convergence Divergence, MACD.
Once again, the website does not guarantee any results or investment return based on the information and instruction you have read here. It should be used as learning aids only and if you decide to trade real money, all trading decision should be your own.