11 December, 2018
Think think got more things.
Thanks for visiting the site.
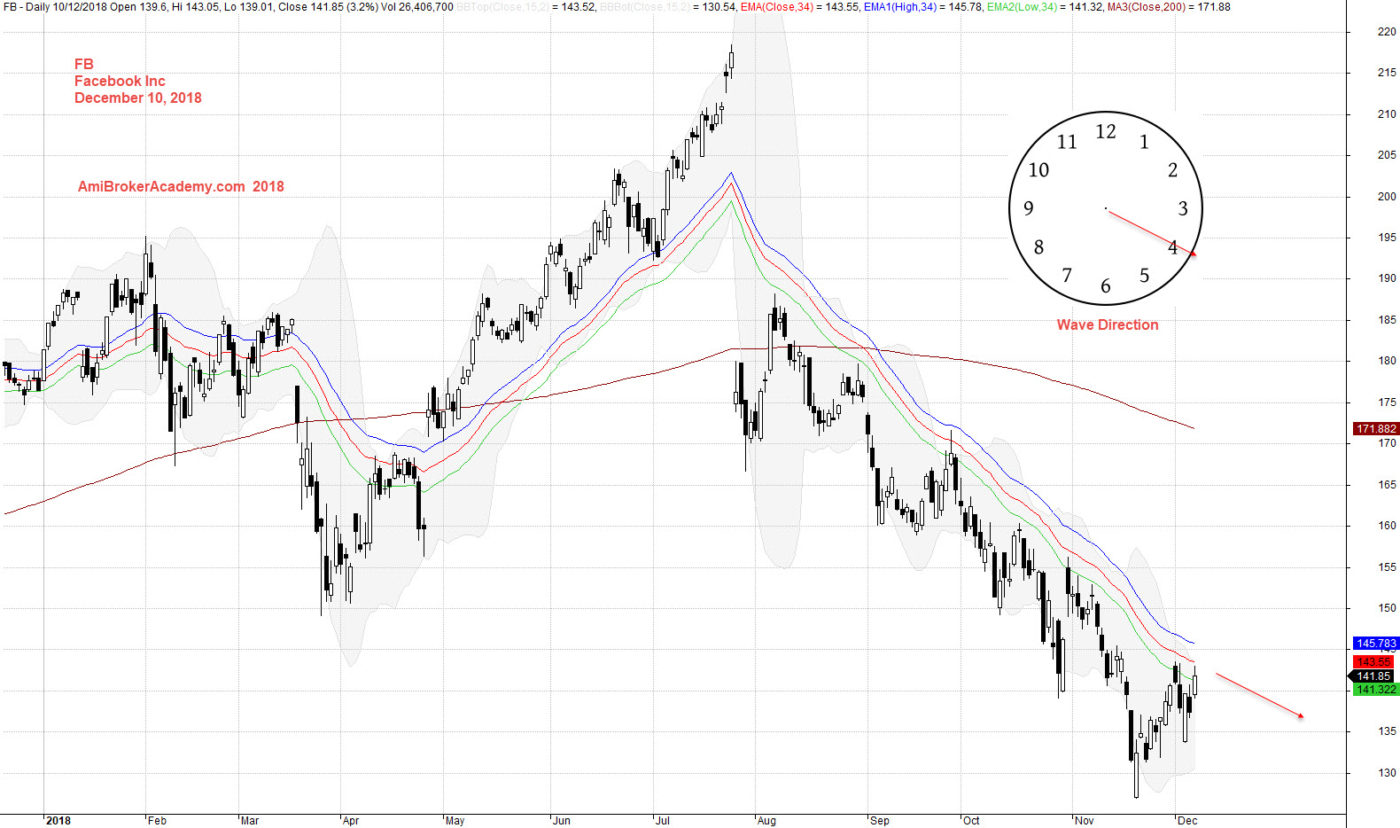
FB Facebook Inc Daily Chart
Buy Low Sell High
Equal to Buy Support Sell Resistance
Price action closed below River and resisted by river, the price action test 150 dollars. The price action then crosses above River, and stay above river. The price action tests near 220 dollars. The price action gap down below River. The price action continue to resisted by River. Besides that River is slopping down. River is made up of three moving averages, a high, low and close moving average.
Trade with your eyes open.
if you can see the full chart, “press Ctrl and -” to zoom out and see the entire chart.
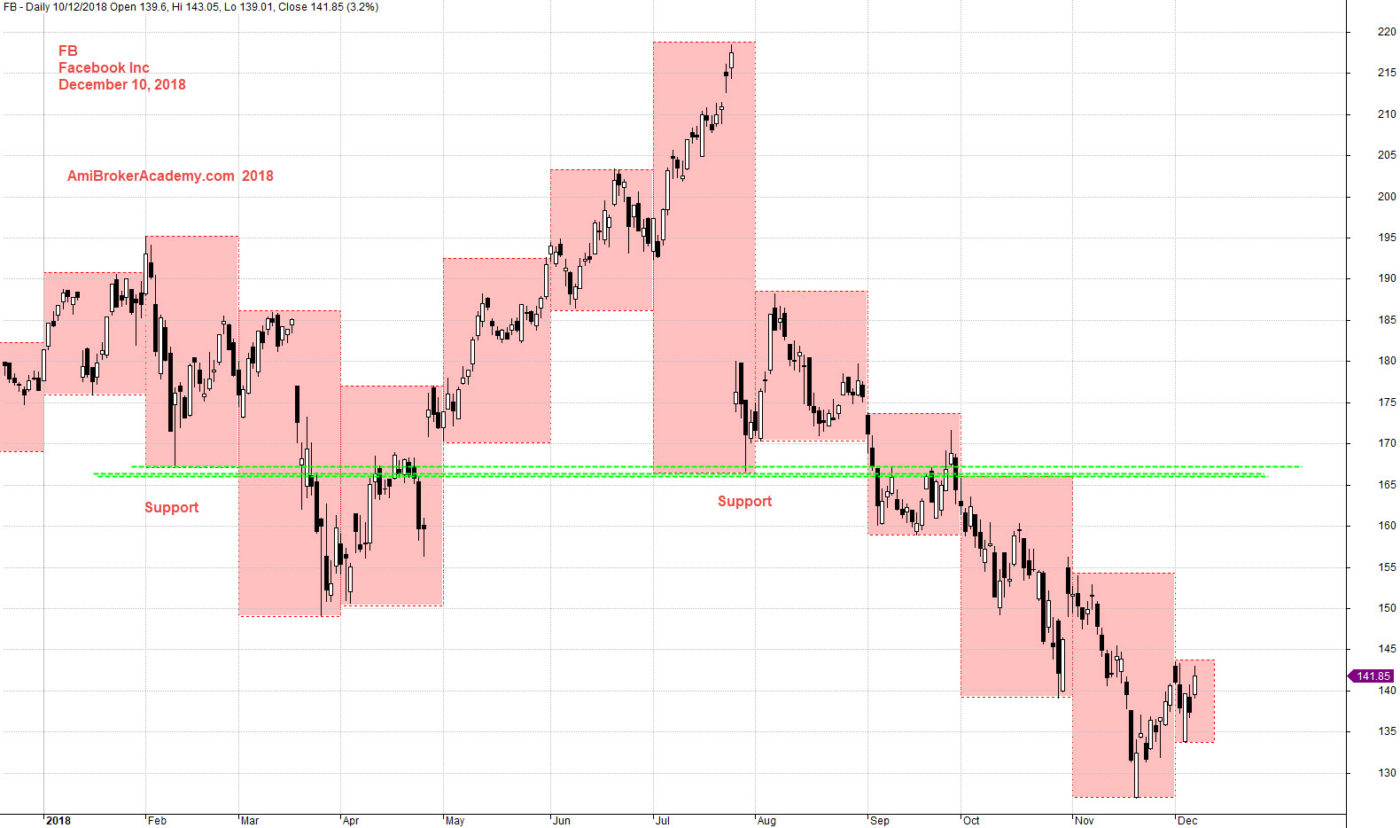
Draw box that the month high low, we can see the price action test the level near 165 dollars. See chart.
Moses US Stock Chart Analysis
AmiBrokerAcademy.com
Disclaimer
The above result is for illustration purpose. It is not meant to be used for buy or sell decision. We do not recommend any particular stocks. If particular stocks of such are mentioned, they are meant as demonstration of Amibroker as a powerful charting software and MACD. Amibroker can program to scan the stocks for buy and sell signals.
These are script generated signals. Not all scan results are shown here. The MACD signal should use with price action. Users must understand what MACD and price action are all about before using them. If necessary you should attend a course to learn more on Technical Analysis (TA) and Moving Average Convergence Divergence, MACD.
Once again, the website does not guarantee any results or investment return based on the information and instruction you have read here. It should be used as learning aids only and if you decide to trade real money, all trading decision should be your own.