1 July 2021
Welcome!
Welcome to AmiBroker Academy dot com, amibrokeracademy.com.
Last Review
We did a review on ST Index price action chart in March, See link ST Index Analysis.
We will use 1) Ichimoku Cloud, 2) Support Resistance (using box), 3) River (moving average), 4) GMMA and Woodies CCI, 5) Bollinger Bands and Moving Averages, and 6) MACD to analyze crypto currency chart. See our reading of price action.
We translate what the price action tell us, ie Picture worth a thousand words.
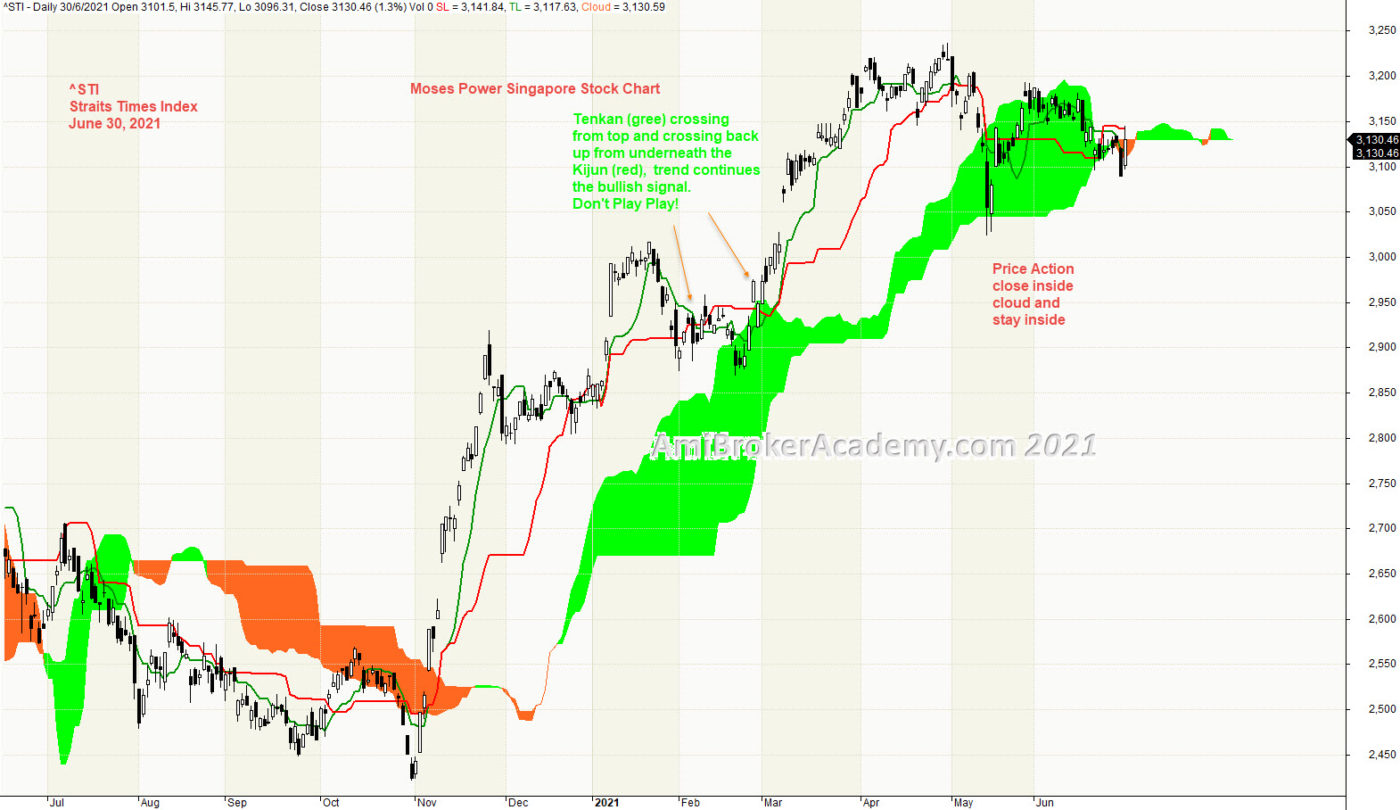
1) ^STI | ST Index | Straits Times Index and Ichimoku Cloud
Ichimoku Cloud is a trend following strategy tool. In 2021 between January and February, we see the Tenkan Sen cross down Kijun Sen and pullback up again. This scenario happened again in May, Thereafter the Tenkan and Kijun are begin to twist against each other. Price Action begin to narrow into a triangle and move sideways.
Ichimoku Cloud is a good trending tool, for trading trend following strategy. It is a multi-dimensional indicator designed to offer support and resistance levels, trending, and entry and exit points. Price Action after test the high and pullback to close below cloud. Price Action stay below cloud, ie bear trend.
Until the price action trend again, otherwise let leave the Ichimoku Cloud aside and focus on other strategy. Remember to trade what you see.
A conclusion for now, 3250 level should be a ceiling for the current market. Have fun!
Manage risk is a key in trading.
Moses Free Charting
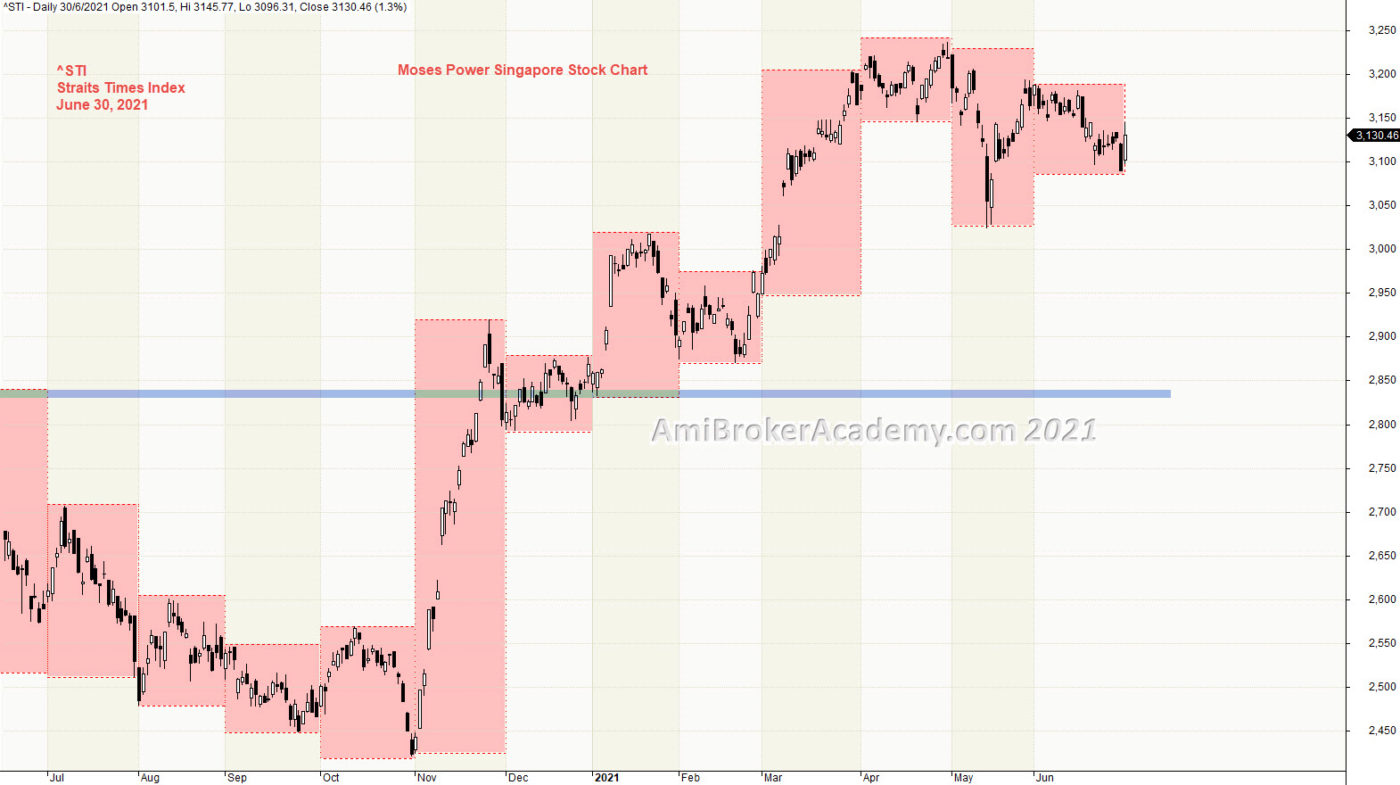
2) Straits Times Index and Support Resistance
Price Action goes from bottom left to top right. However, the price action seem hitting the ceiling. And begin to track sideways. From the box, after the April month high, the next three months, each month is lower the the previous month. t
We use box to box month high low to find support resistance and major level. See chart. We plot a strong levels for the price action to land. Will it lands well, will see.
Trade what you see. Manage your risk.
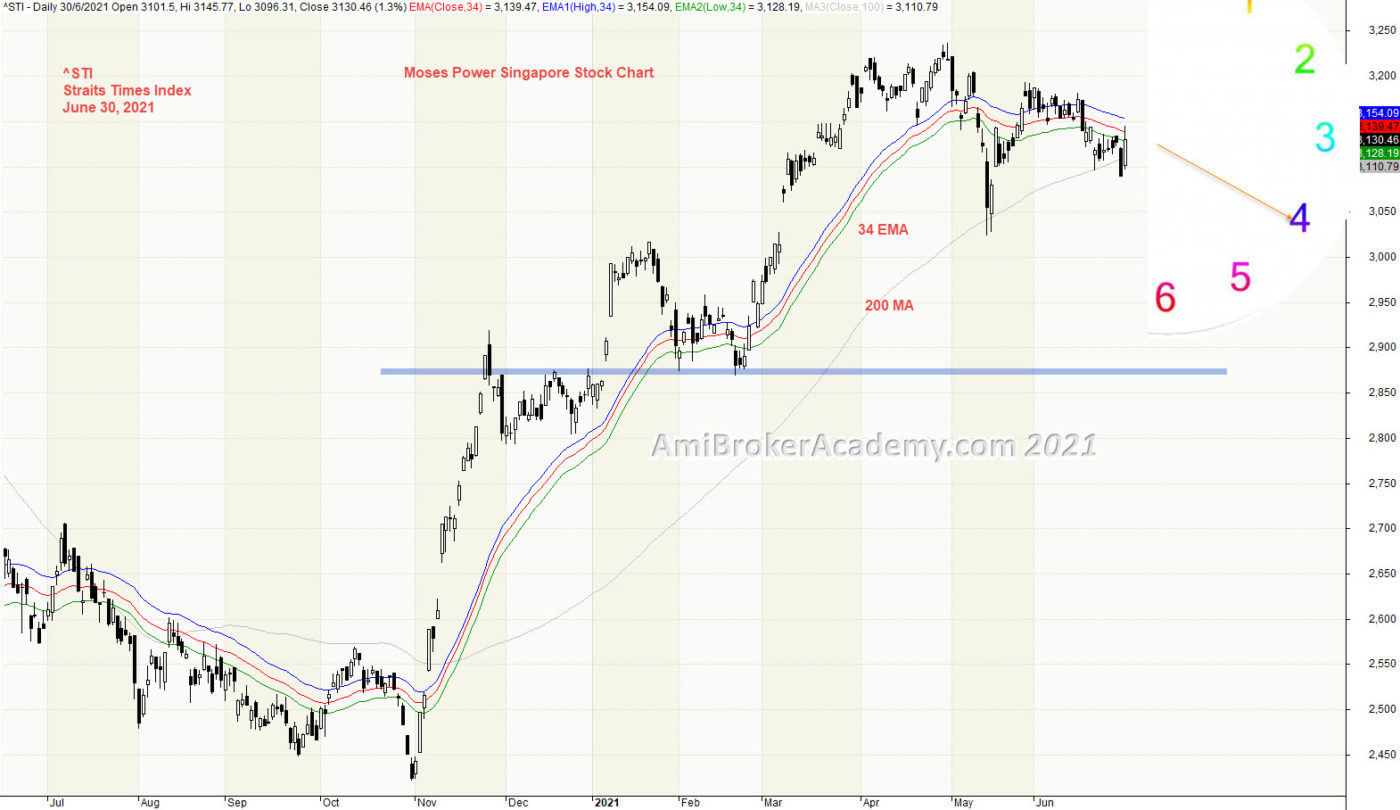
3) Straits Times Index and River
Moving Average is a great visual tool. Raghee uses high, low and close 34 EMA to form a band to determine the wave direction. She did not call it River, but we did for easy referencing. Isn’t it? Price action is currently close below River and get resisted by River. River begin to bend downward, and draw near 200 MA (slow MA). Will we expected a Dead Cross? Will see. Trade what you see.
From a different perspective, we see the price action supported by 200 MA.
Manage your risk.
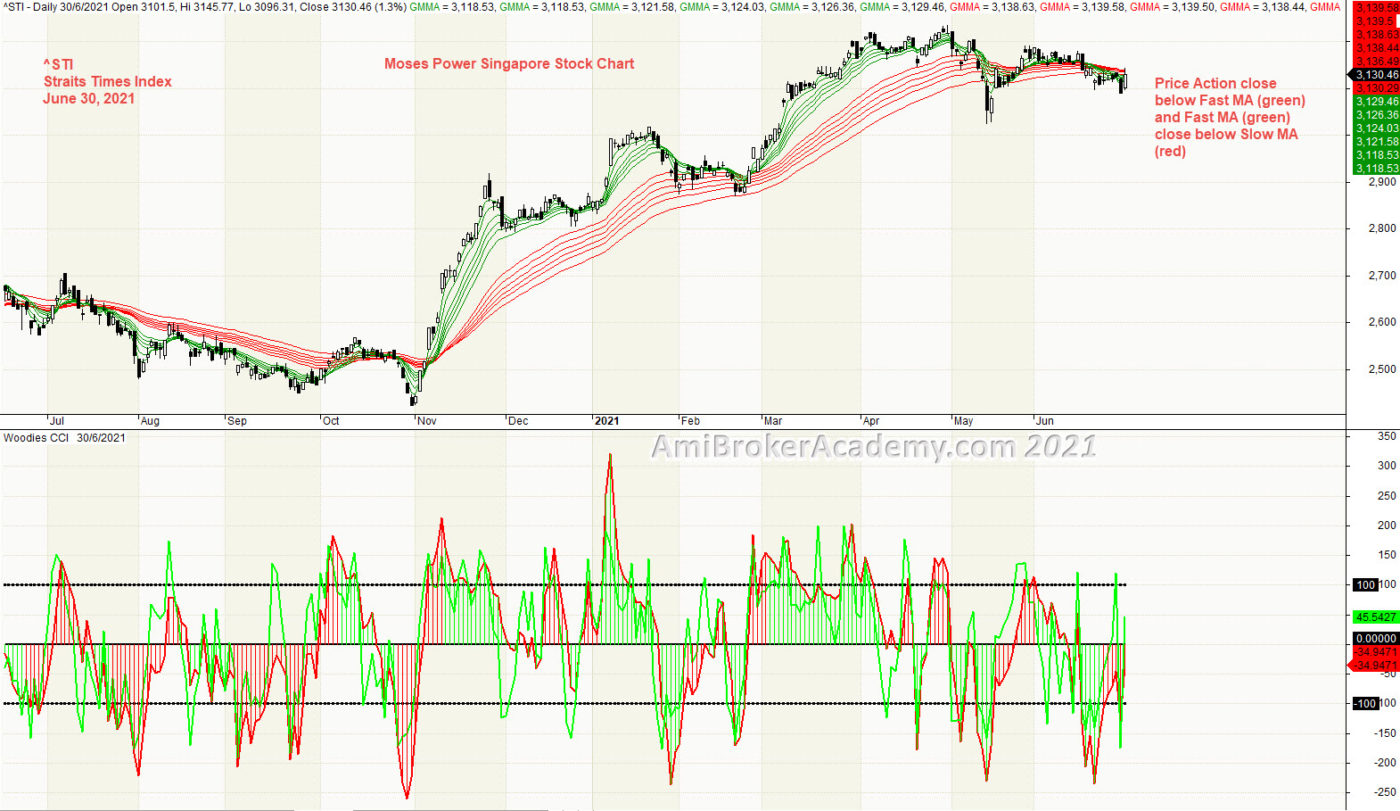
4) Straits Times Index and GMMA and Woodies CCI
Price Action crosses down under Slow MA (red), Fast MA (green) has also closed under Slow MA (red) in May. Price Action pullback to stay above the moving averages, but fail. Can the price action retrace above MA again? Will see. Trade with eyes open.
Watch out, the ceiling might be already reach. Trade safely.
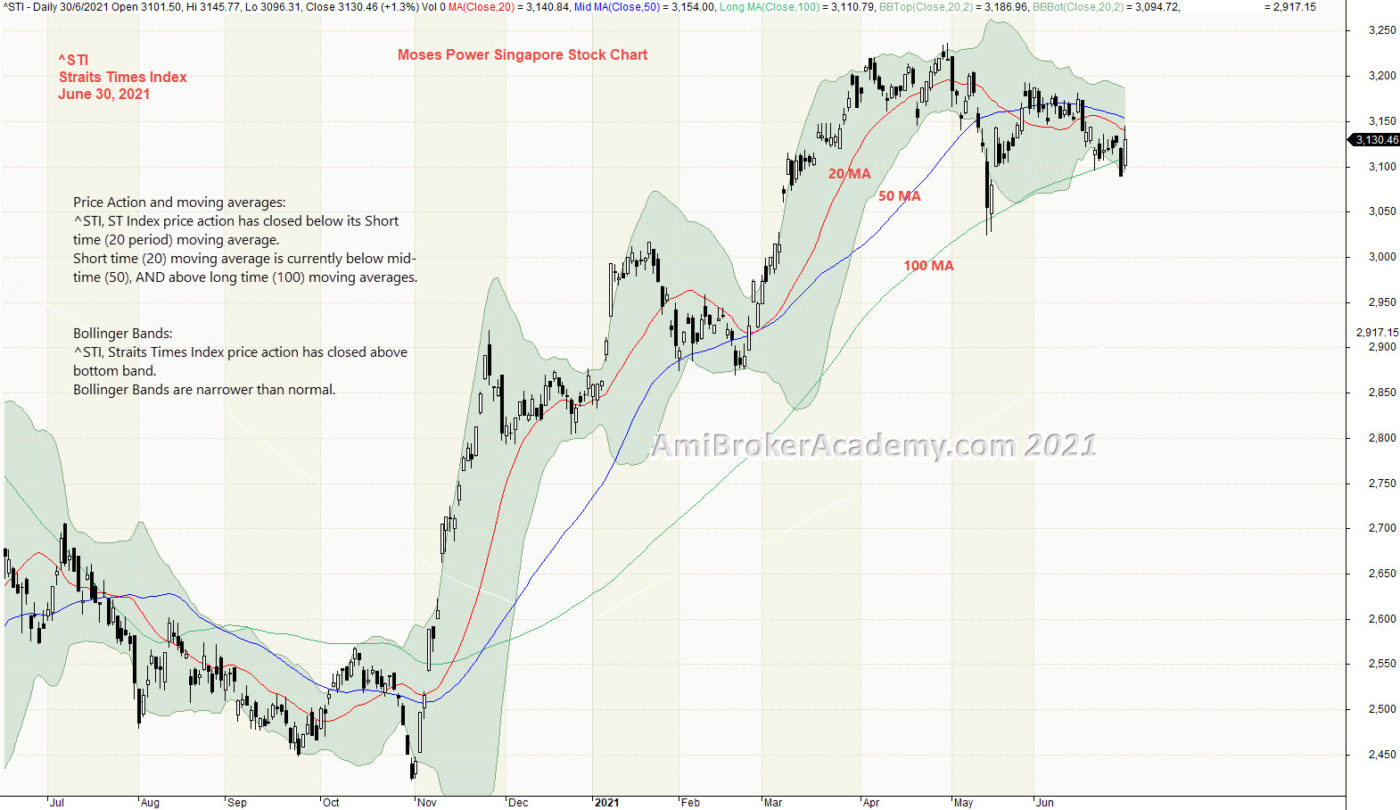
5) 20210630 Straits Times Index and Bollinger Bands and Moving Averages
Price Action and moving averages:
^STI, ST Index price action has closed below its Short time (20 period) moving average.
Short time (20) moving average is currently below mid-time (50), AND above long time (100) moving averages.
Bollinger Bands:
^STI, Straits Times Index price action has closed above bottom band.
Bollinger Bands are narrower than normal.
Bollinger Bands is a great visual tool, price action is trapped within the two bands. The bands expand when price action volatile, and bands contract when the price action is building up energy before big move. See the bands for more insight.
Manage your risk.
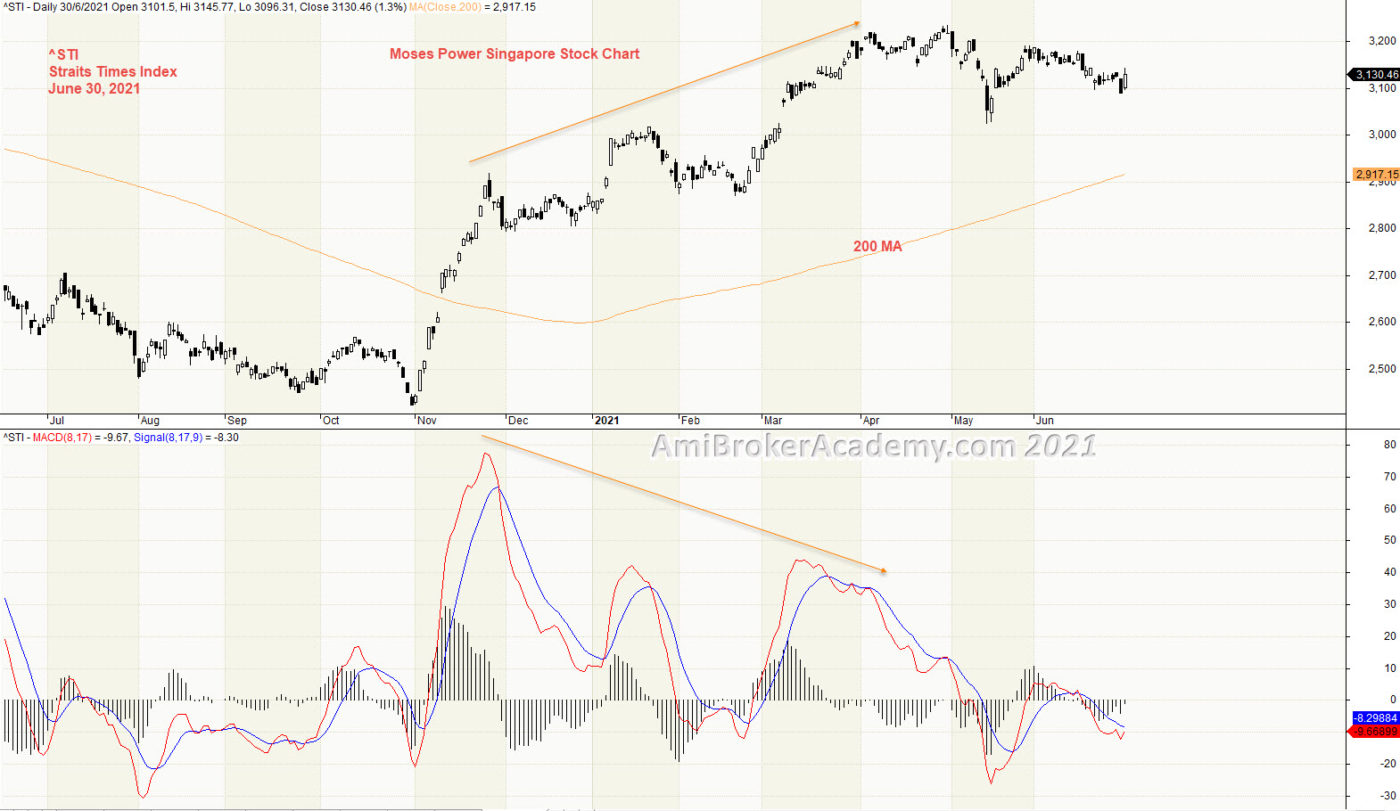
6) Straits Times Index and MACD Divergence
We see price action continues to go higher. Price Action is currently above 200 MA. After the high at April, the price action begin to be weaker and started to test south. Remember all these can not come without any early signals. When you study MACD, you will find MACD forms lower high. MACD Divergence. MACD Divergence is a signal you must respect and observe. It is just like if you drive, you need to watch and follow the traffic light direction. MACD Divergen signal you price is moving south, so trade with eyes open, to take profit and go.The price action is starting to weaken, price action is ready to go south anytime. Of course, just like traffic light, you do not stop at every traffic light, But it is wise to trade with what you see. Manage your risk.
Don’t take MACD Divergence too lightly.
Moses Power Charting
Official AmiBrokerAcademy.com Charting
Disclaimer
The above result is for illustration purpose. It is not meant to be used for buy or sell decision. We do not recommend any particular stocks. If particular stocks of such are mentioned, they are meant as demonstration of Amibroker as a powerful charting software and MACD. Amibroker can program to scan the stocks for buy and sell signals.
These are script generated signals. Not all scan results are shown here. The MACD signal should use with price action. Users must understand what MACD and price action are all about before using them. If necessary you should attend a course to learn more on Technical Analysis (TA) and Moving Average Convergence Divergence, MACD.
Once again, the website does not guarantee any results or investment return based on the information and instruction you have read here. It should be used as learning aids only and if you decide to trade real money, all trading decision should be your own.
We learn from many past and present great traders. Kudo to these master.