March 29, 2018
Black Monday October 19, 1987 on Stock Like IBM
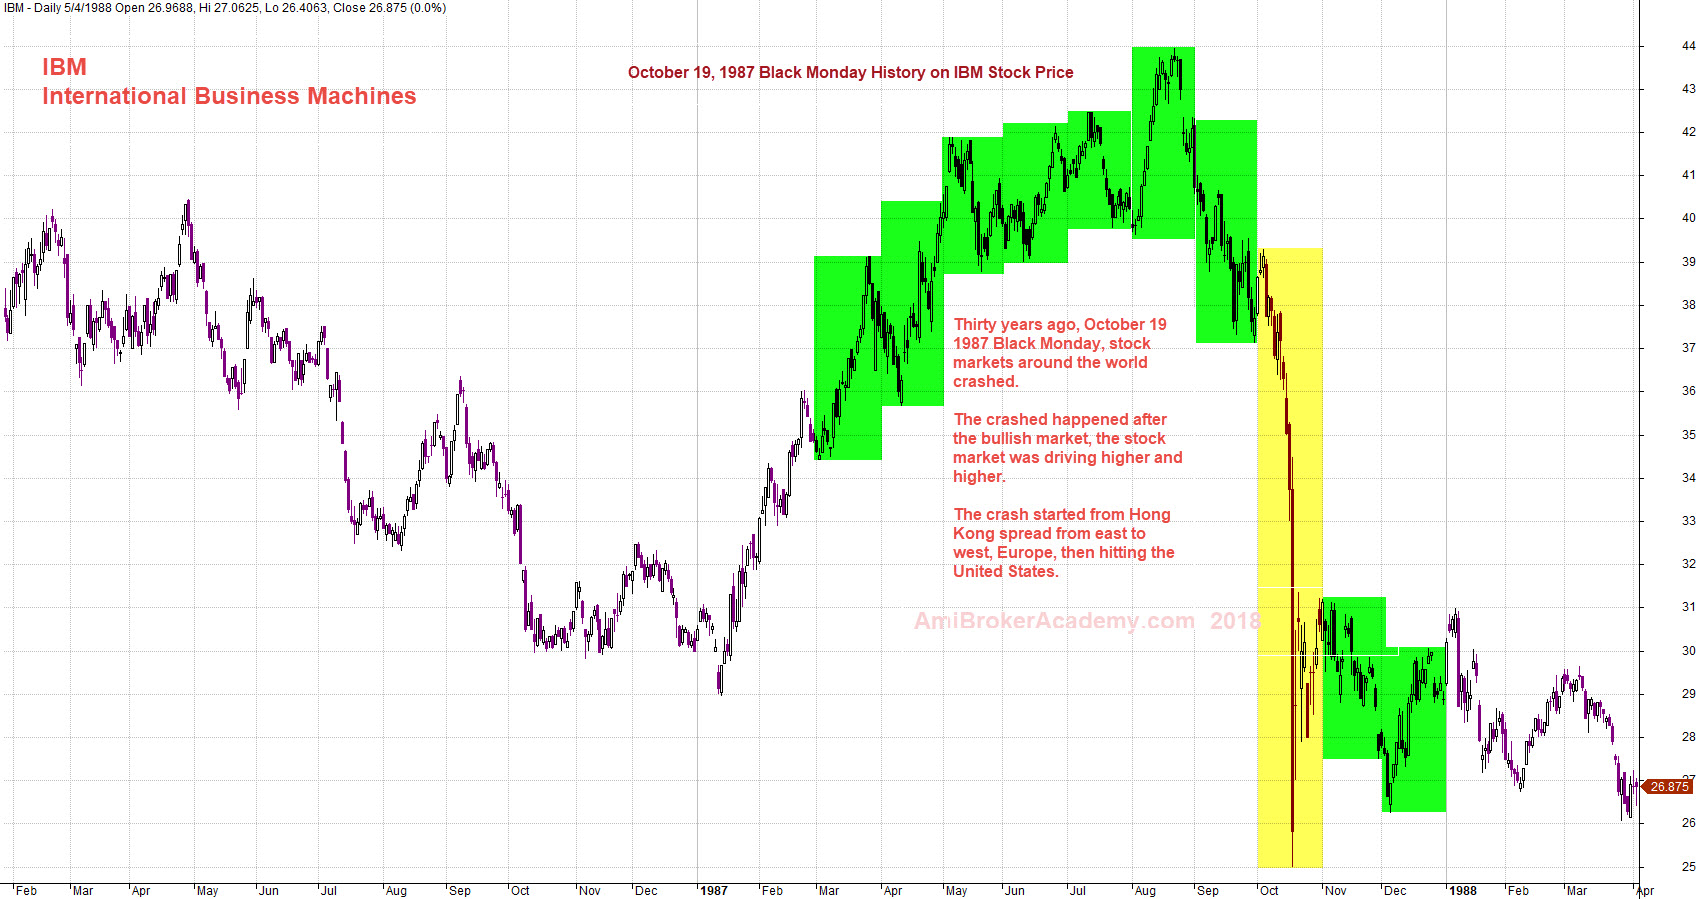
Thirty years ago, on October 19, 1987 the stock markets around the world crashed. The following chart was what happen to IBM stock price. In financial, October 19, 1987 has named Black Monday. The crash was started from East Hong Kong spread to west Europe and ended in United State.
US Stock Chart Analysis
IBM International Business Machines Charting – Black Monday Crashed
Study the chart on IBM, at the start of 1987, the stock price just continue to be bullish, very strong trend. Drive the price so high. And the market just can not believe the stock price should be so high and began to sell off. The market crashed, the stock price followed the market. The stock fall below the start of 1987. See chart for more.
Manage your risk. Avoid to buy high and sell higher.
Powerful Chart Software – AmiBroker
The following chart is produced using AmiBroker charting software. It is a powerful chart software. Anything, finance ticket you could download from Yahoo! Finance you could plot them, those you are interested all in a chart, so you could analyse them. The further you can download from Yahoo! Finance is 1970. Enjoy your learning.
October 19, 1987 International Business Machines and Black Monday Charting
Moses US Stock Chart Analysis
AmiBrokerAcademy.com
Disclaimer
The above result is for illustration purpose. It is not meant to be used for buy or sell decision. We do not recommend any particular stocks. If particular stocks of such are mentioned, they are meant as demonstration of Amibroker as a powerful charting software and MACD. Amibroker can program to scan the stocks for buy and sell signals.
These are script generated signals. Not all scan results are shown here. The MACD signal should use with price action. Users must understand what MACD and price action are all about before using them. If necessary you should attend a course to learn more on Technical Analysis (TA) and Moving Average Convergence Divergence, MACD.
Once again, the website does not guarantee any results or investment return based on the information and instruction you have read here. It should be used as learning aids only and if you decide to trade real money, all trading decision should be your own.